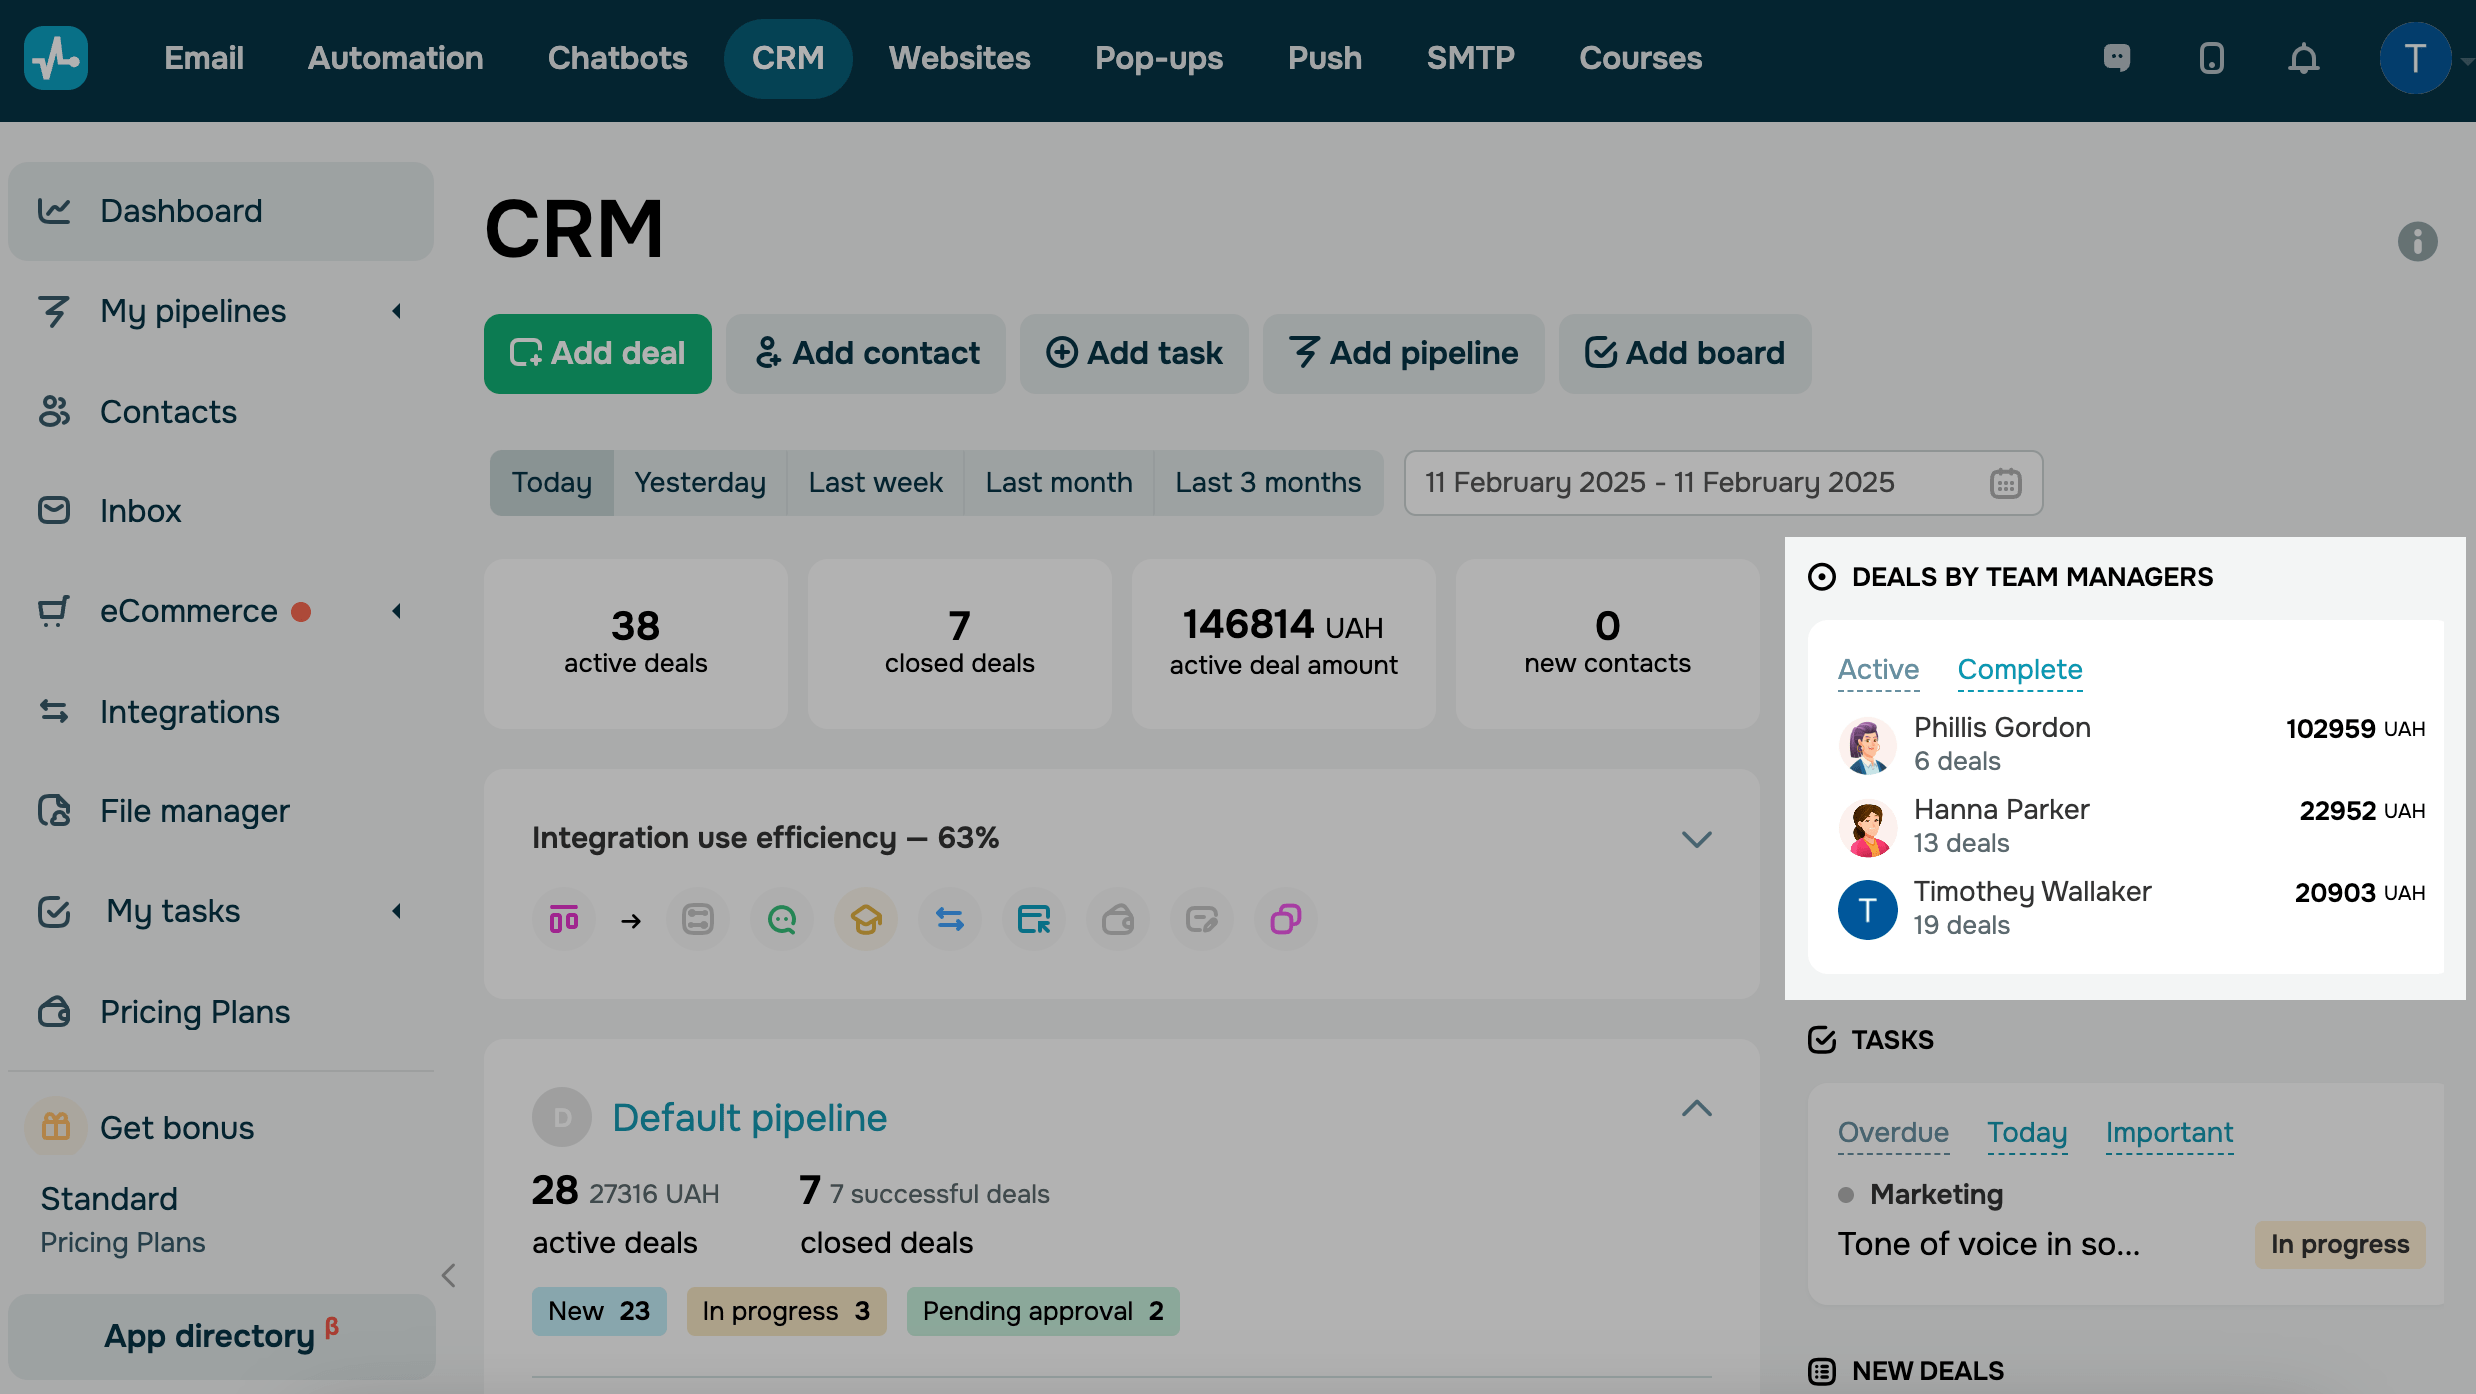
How to View CRM Statistics
With the help of a CRM dashboard, you can view aggregated visual representations of information on all your pipelines, deals, and team members to monitor and analyze work efficiency.
To view statistics, click on "CRM" in the top panel or on "Dashboard" in the left panel.

Display Period
Select the period you want to display statistics for all indicators on the page. You can select statistics for the current day, the previous day, the last week, month, quarter, or set dates.
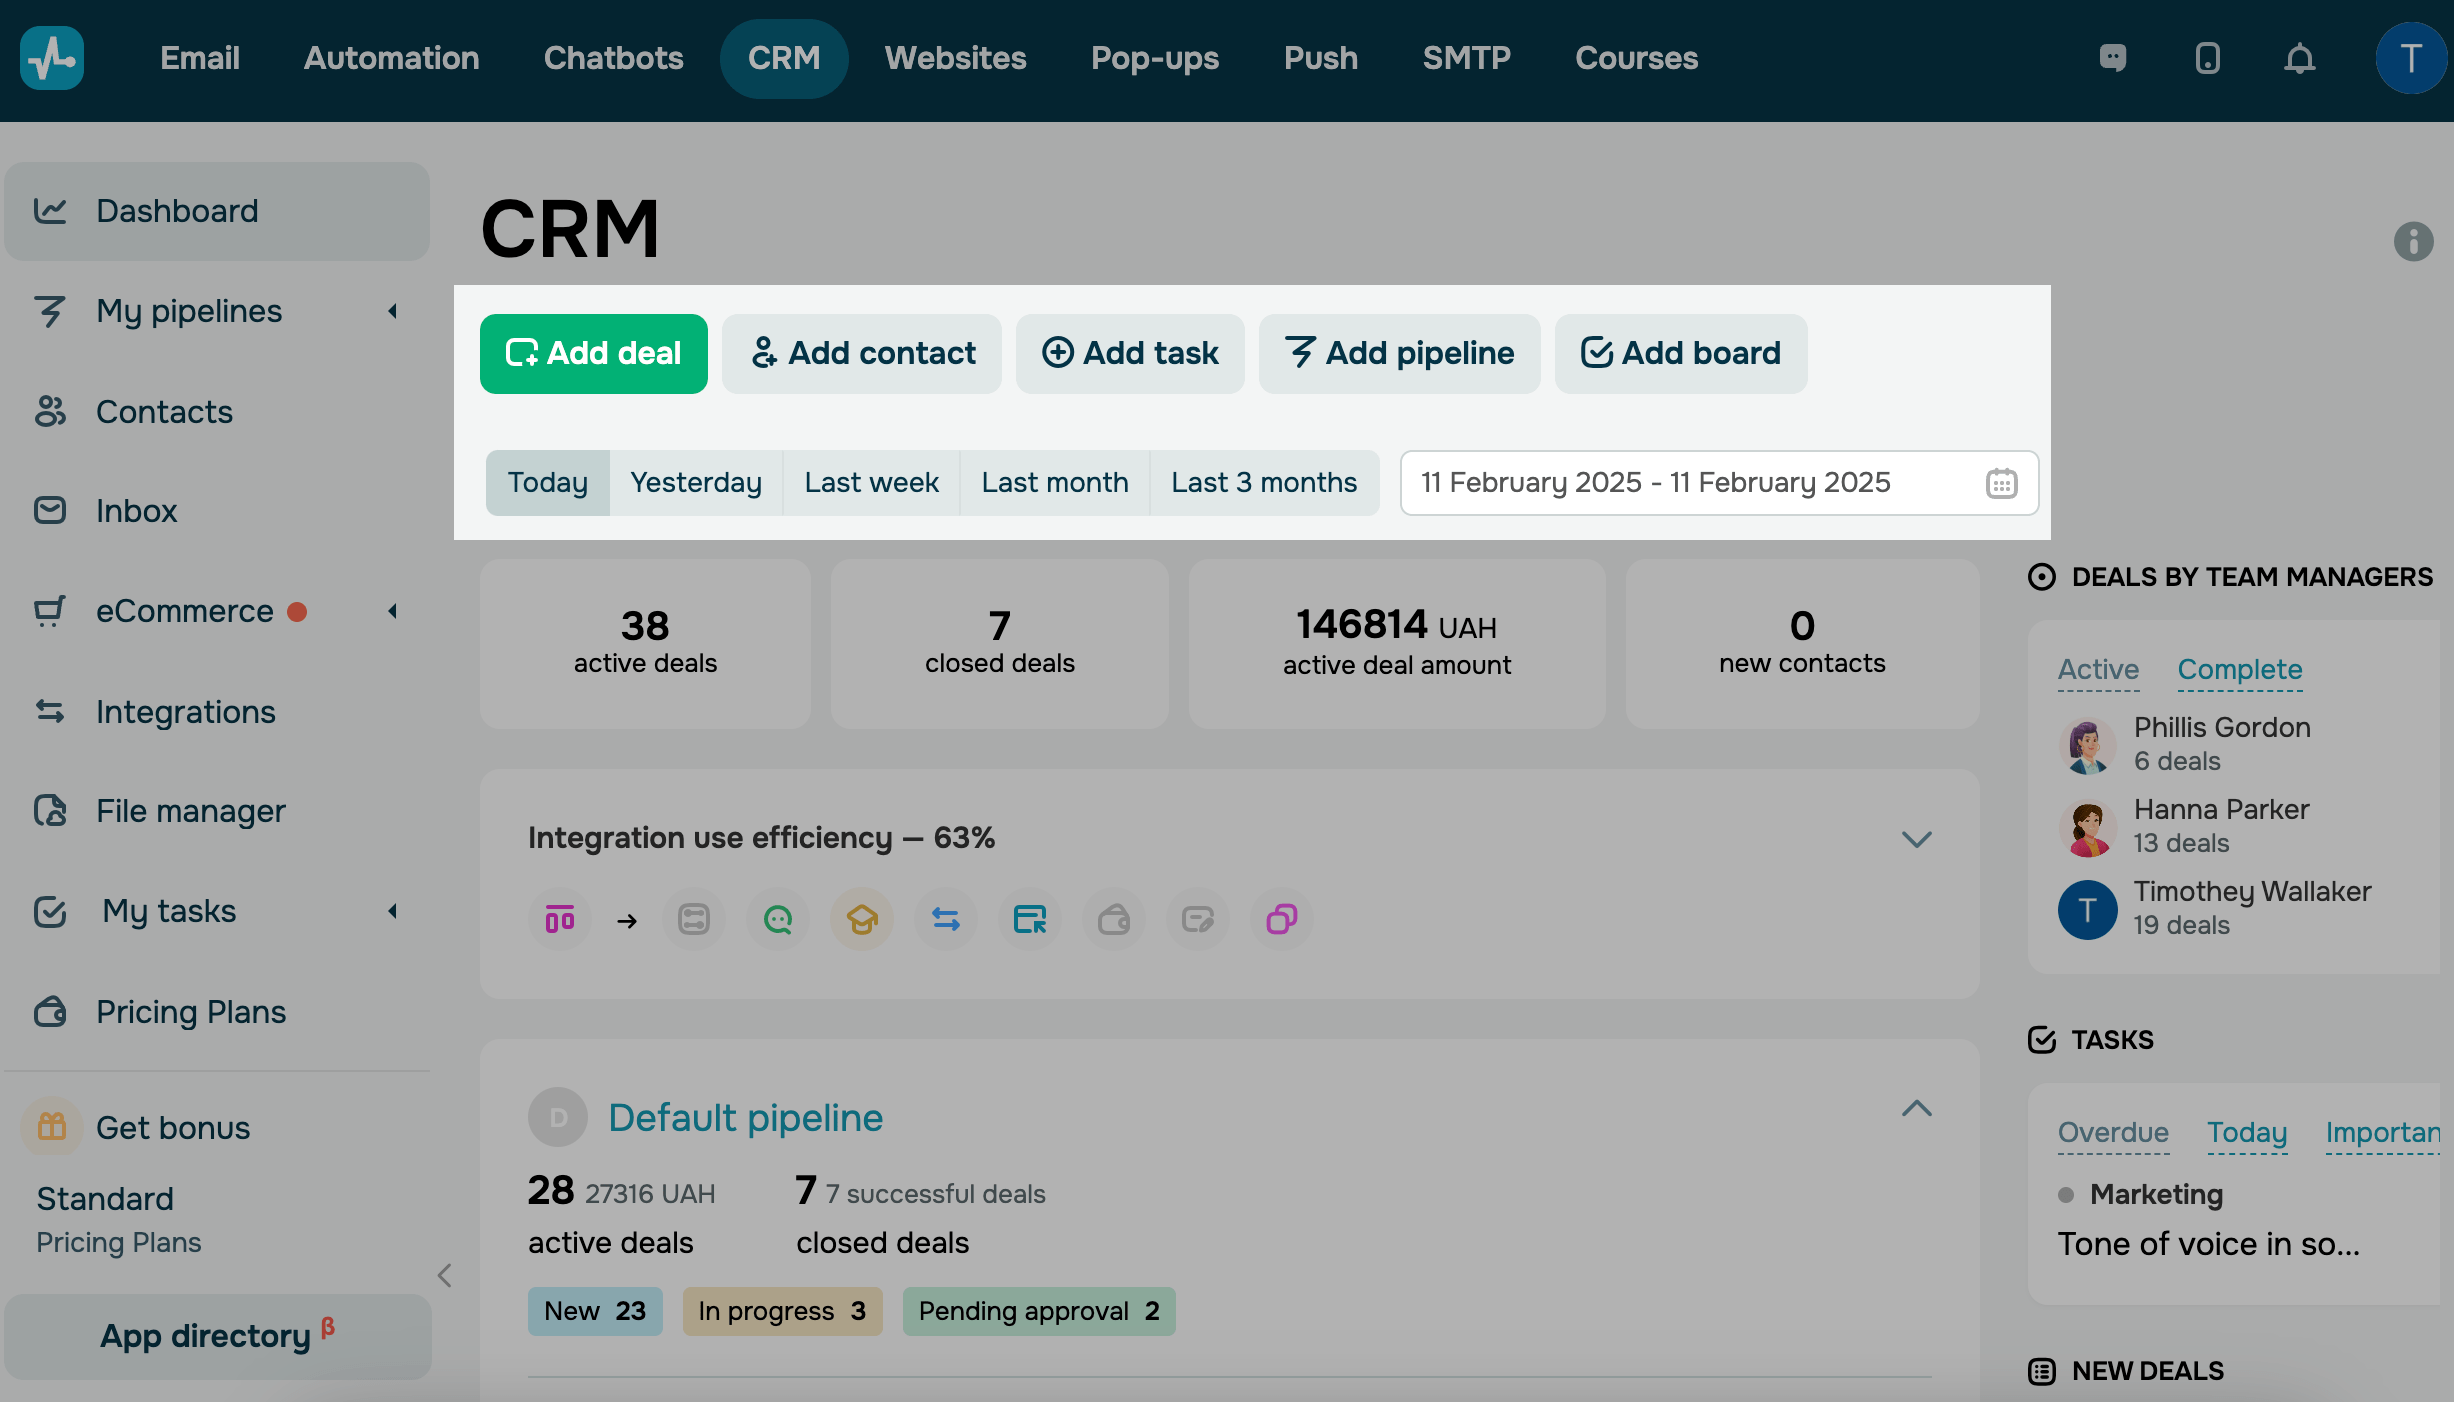
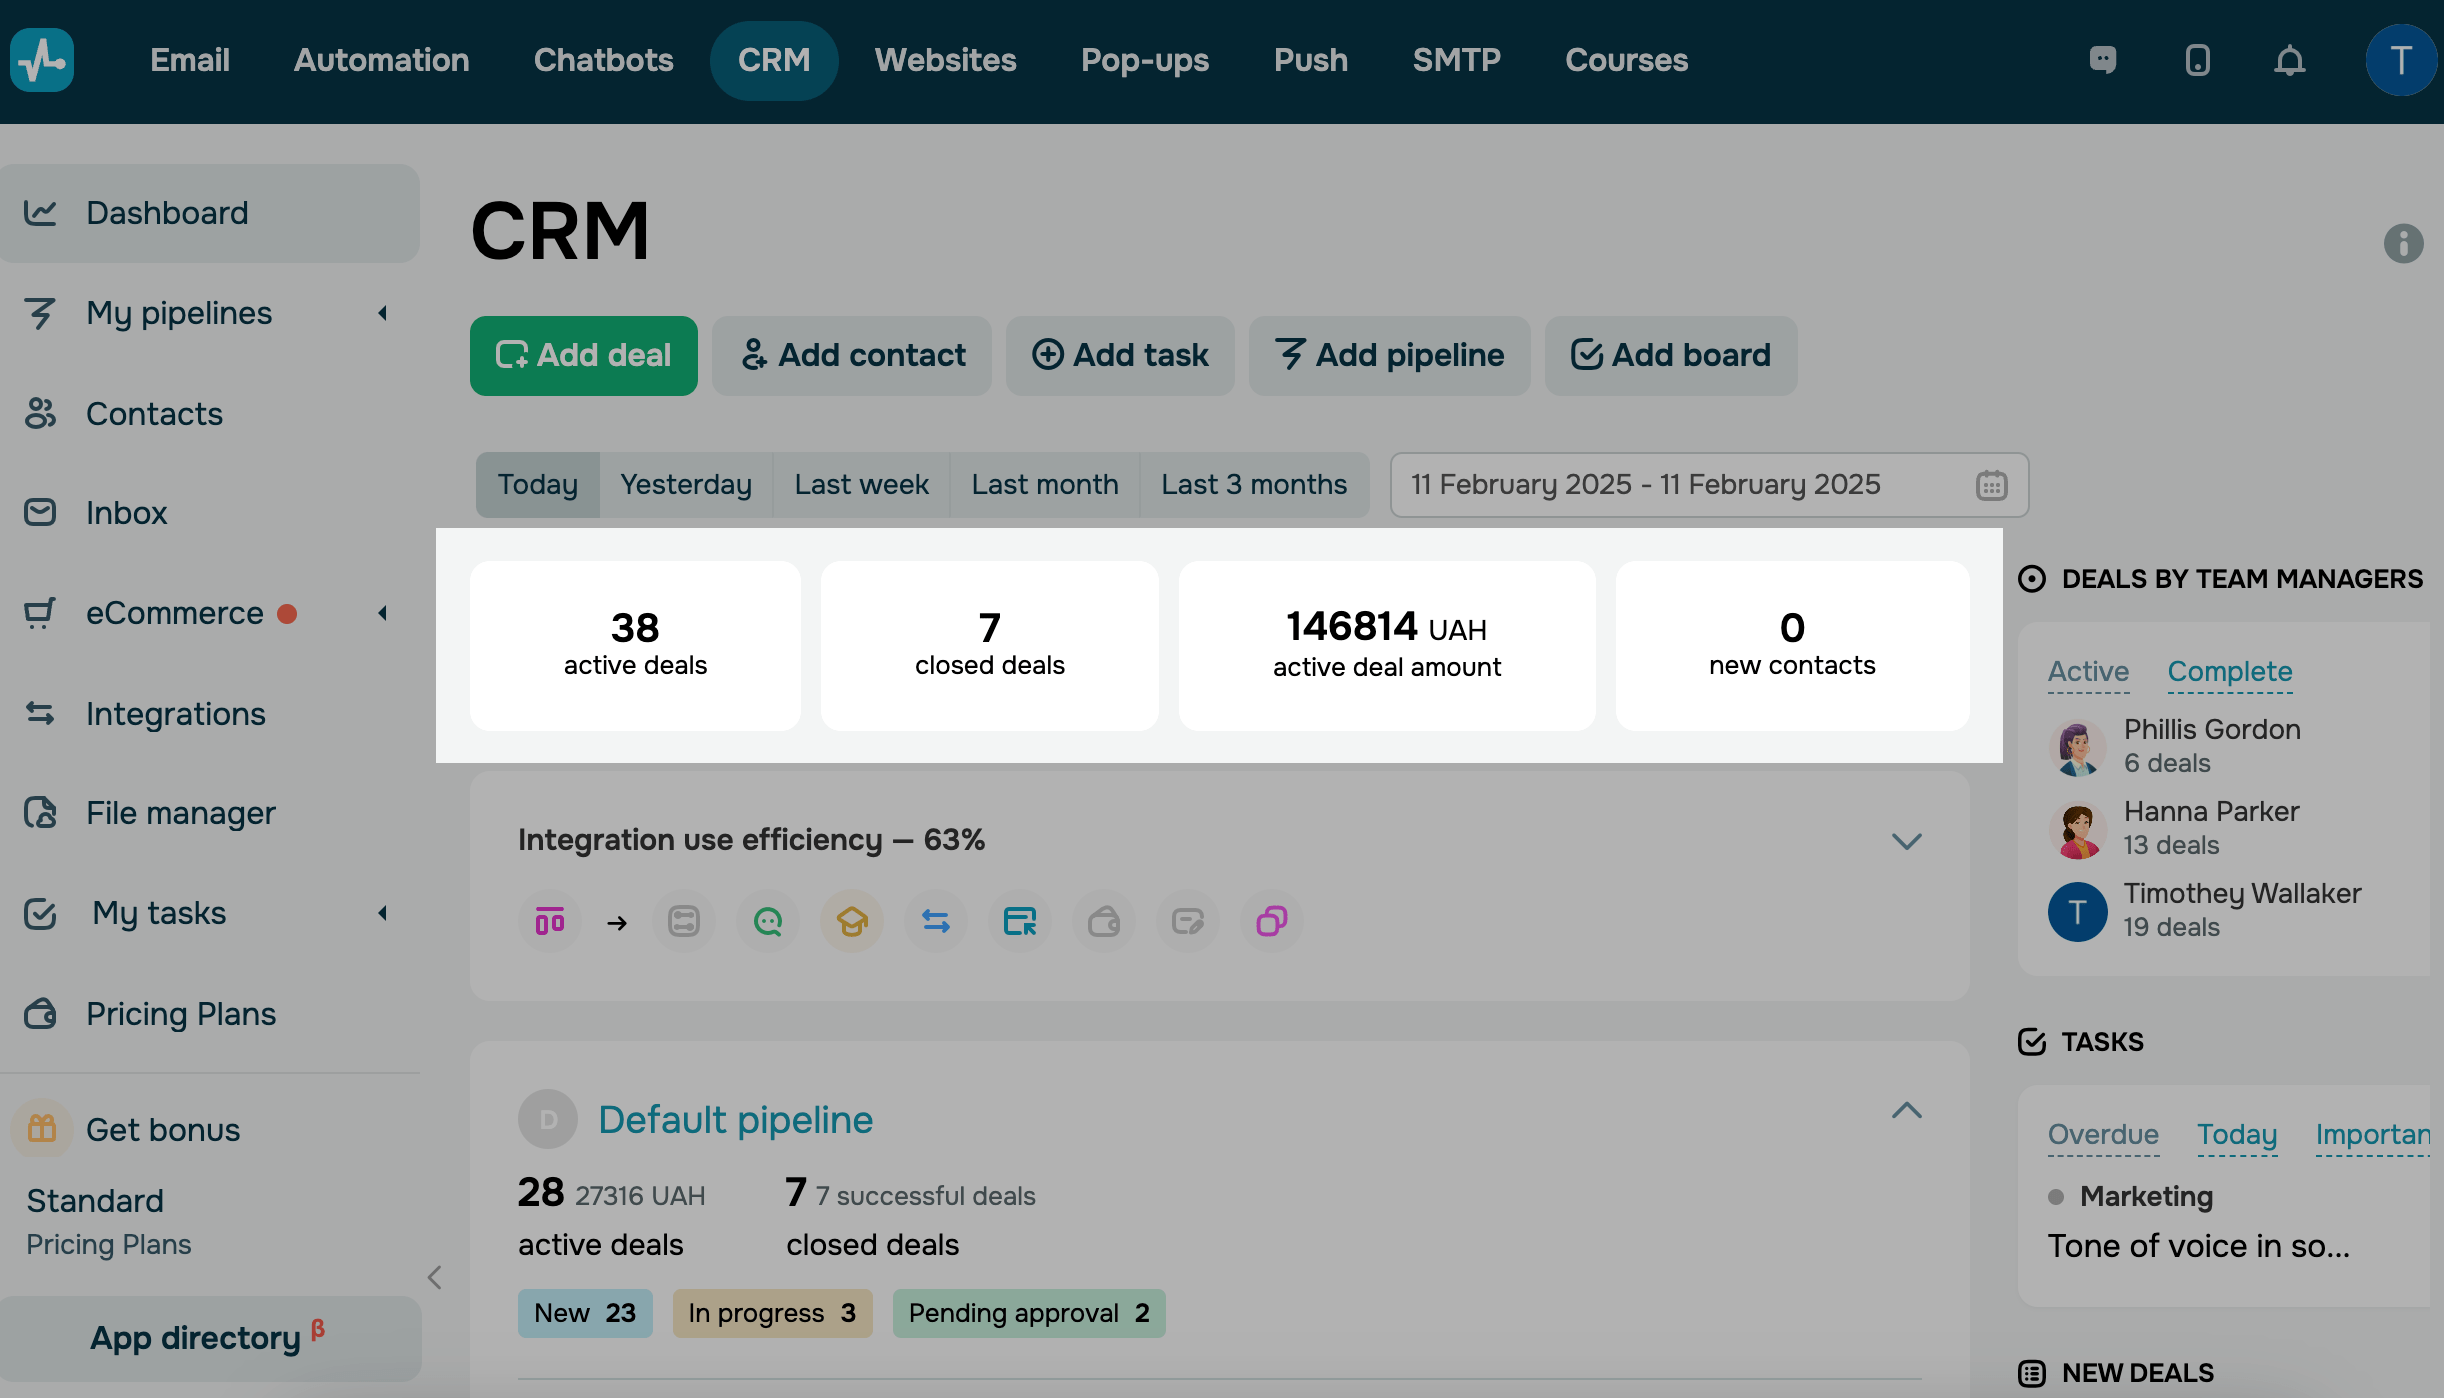
Total Statistics
This section shows the total number of active and closed deals, the number of contacts added, and the number of deals for the selected period for all pipelines.
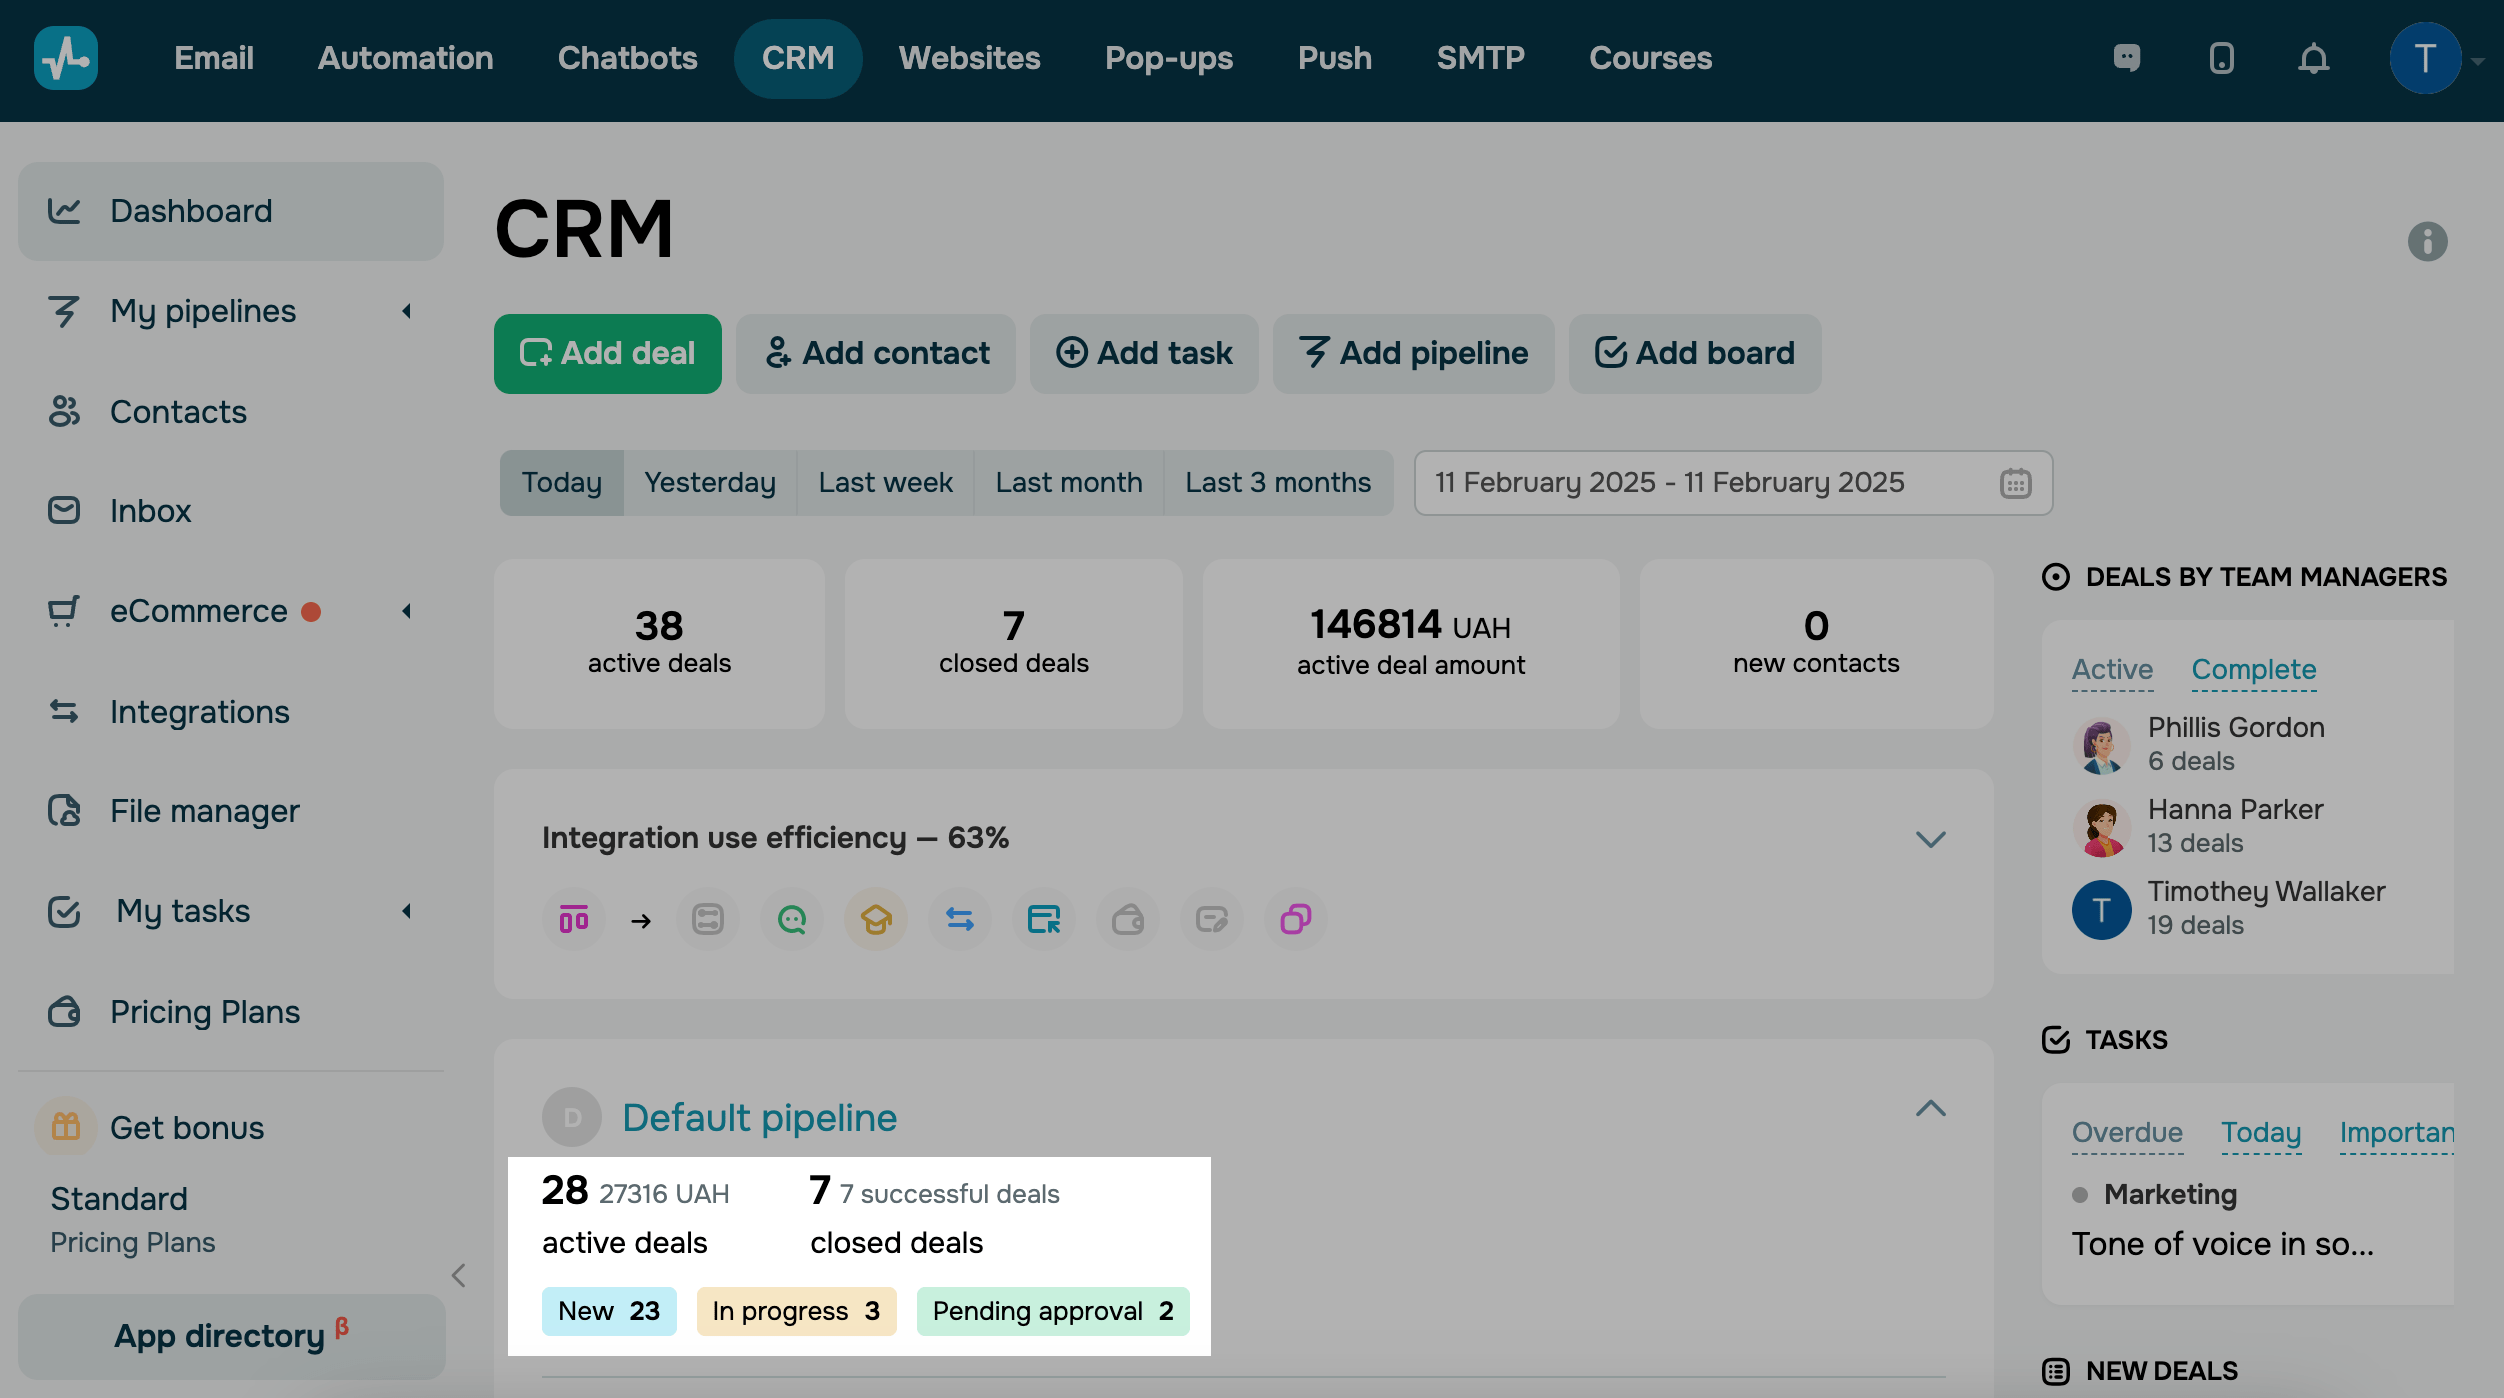
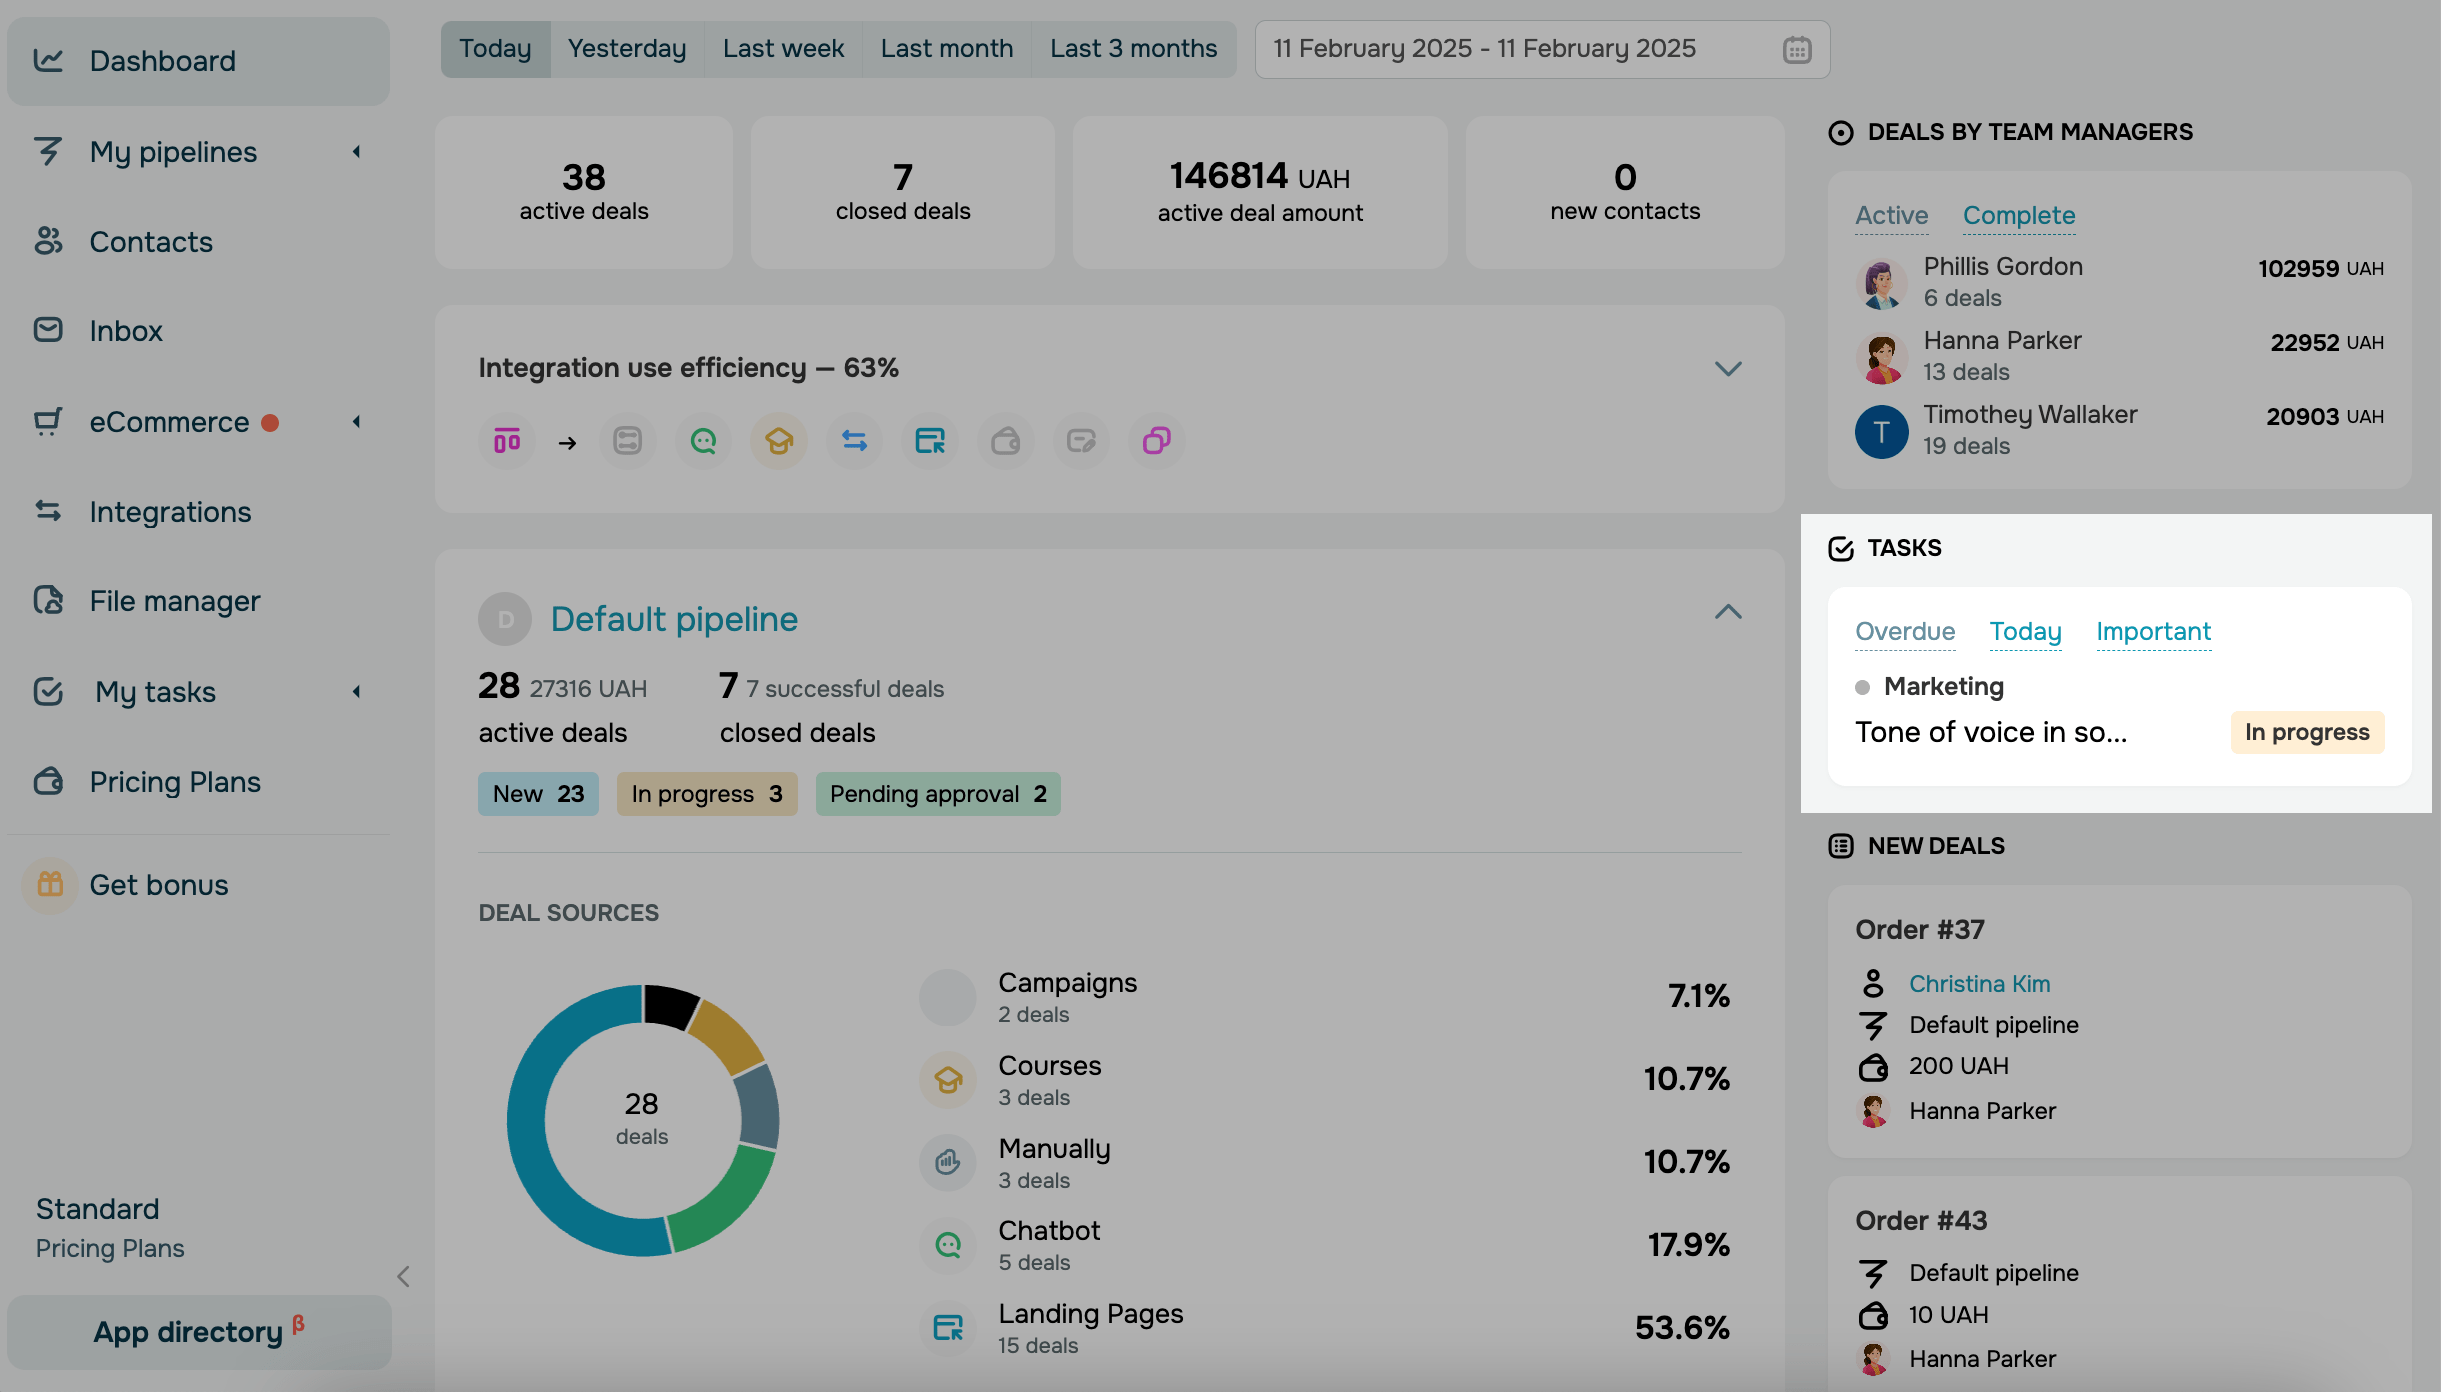
Pipeline Statistics
General Indicators
Below, the total number and sum of active and closed deals is displayed for each pipeline.

Here you will also find the number of deals for each deal stage.
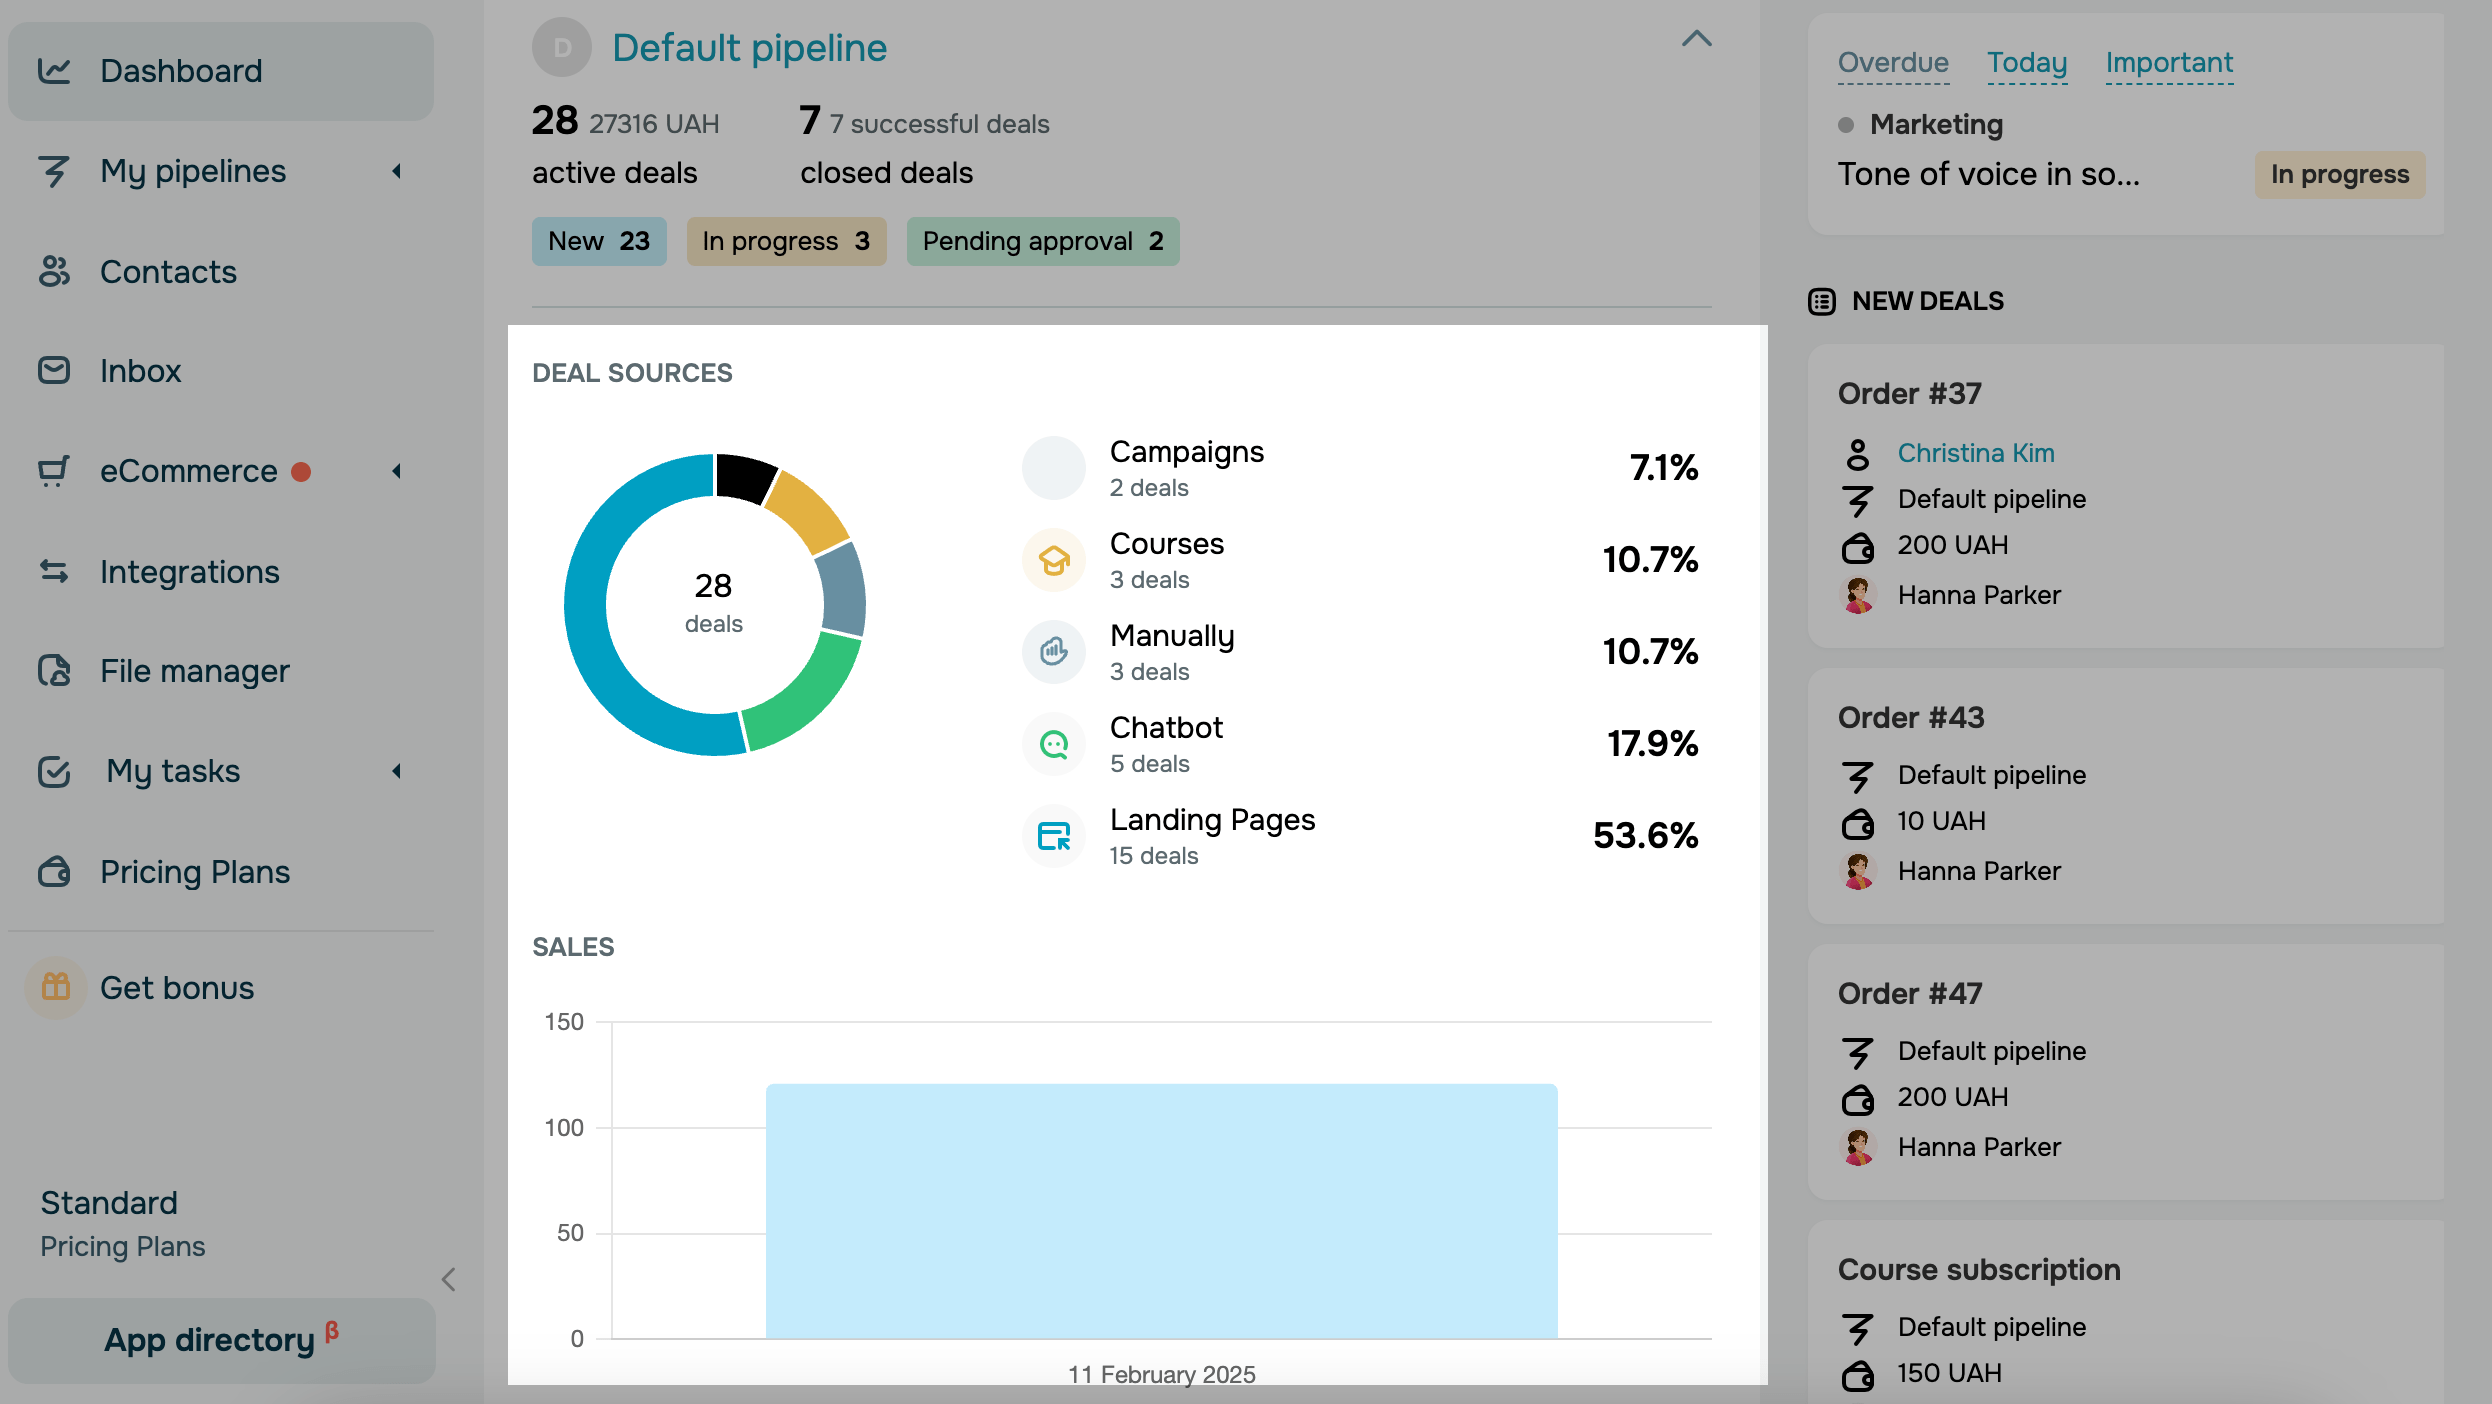
Sources of Deals
Pie charts are also available to show the sources of adding deals.
The source of adding deals can be:
| Automation 360 | deals were added when the contact went through the "Action — Create Deal" element in A360. |
| Manually | deals were created manually in the "Deals" section of the CRM. |
| Landing pages | deals were added when the visitor signed up through the subscription form created in the SendPulse landing pages builder. |
| Payments | deals were added after making a payment in the chatbot or landing page. |
| Chatbot | deals were added when the user went through the "Action - Create Deal" element in the chatbot. |
| API | the deal was created via connected integrations using the API deal creation method. |
| Forms | deals were created when the contact signed up through the subscription form created in the SendPulse form builder. |
Team Member Statistics
You can see the number and monetary amount of deals for each team member on the right.
To see active and completed deals switch between the "Active" and "Complete" tabs.
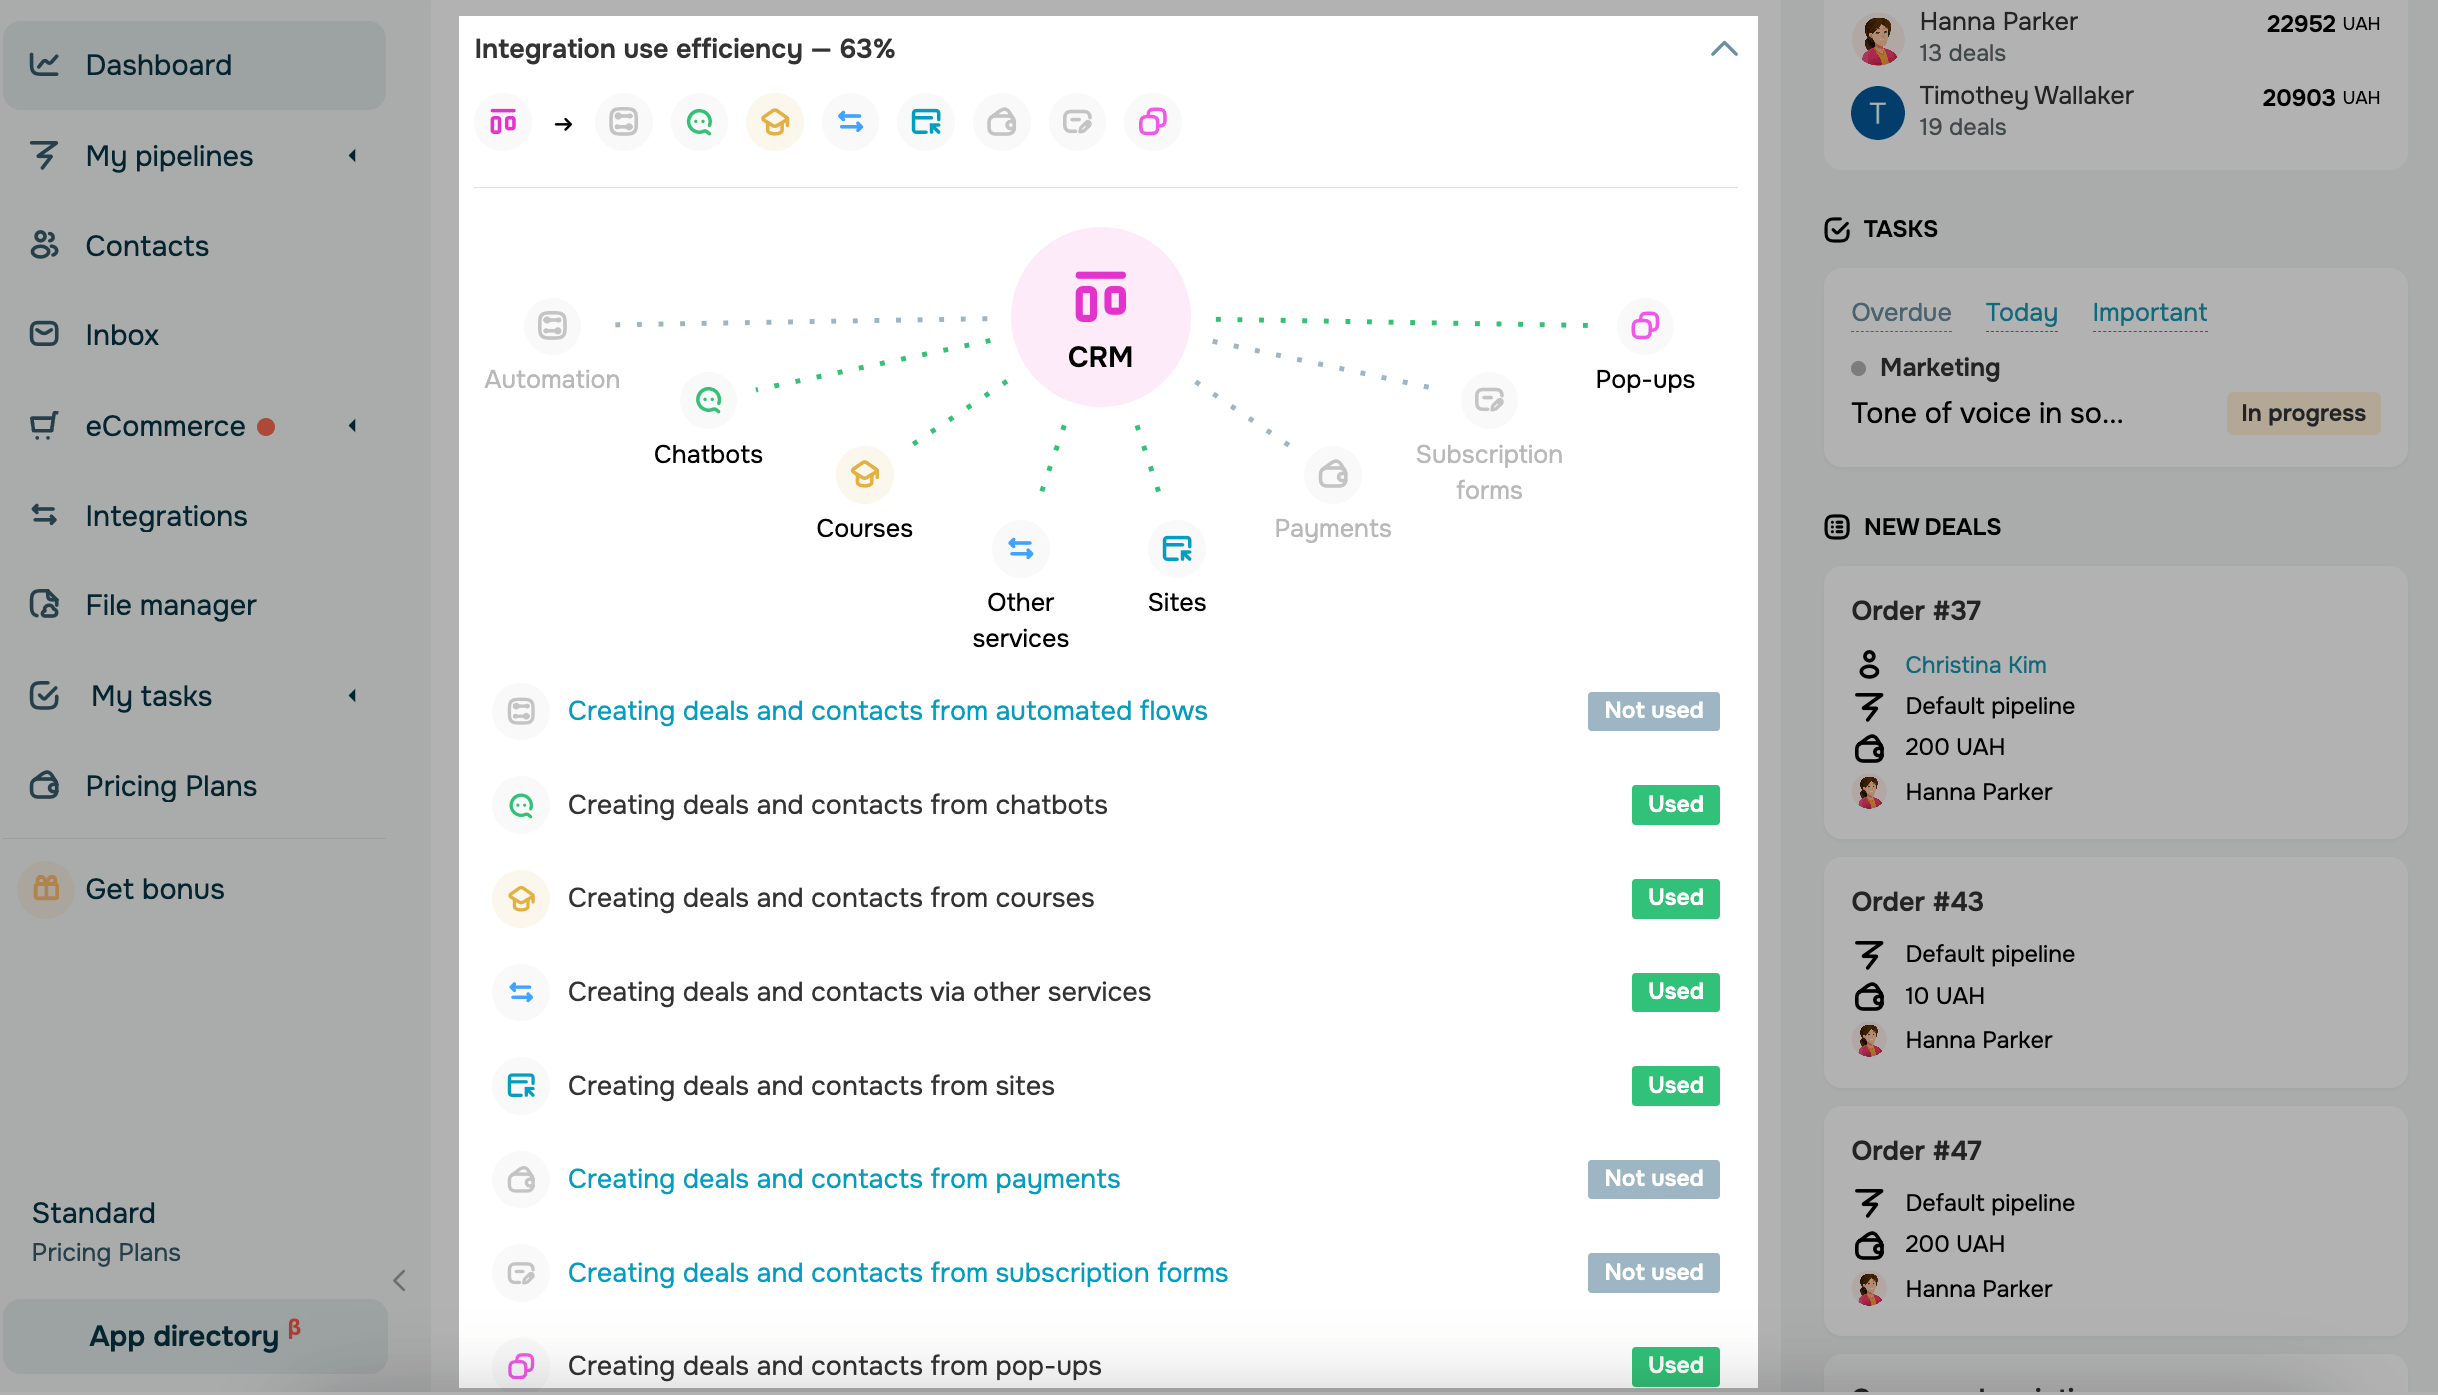
Integration Use Efficiency Statistics
You can integrate CRM with all of the SendPulse services. View your integration use efficiency statistics on the home page to see what other tools you can implement to grow your business.

To see which SendPulse services are in use and which are not, click the down arrow.
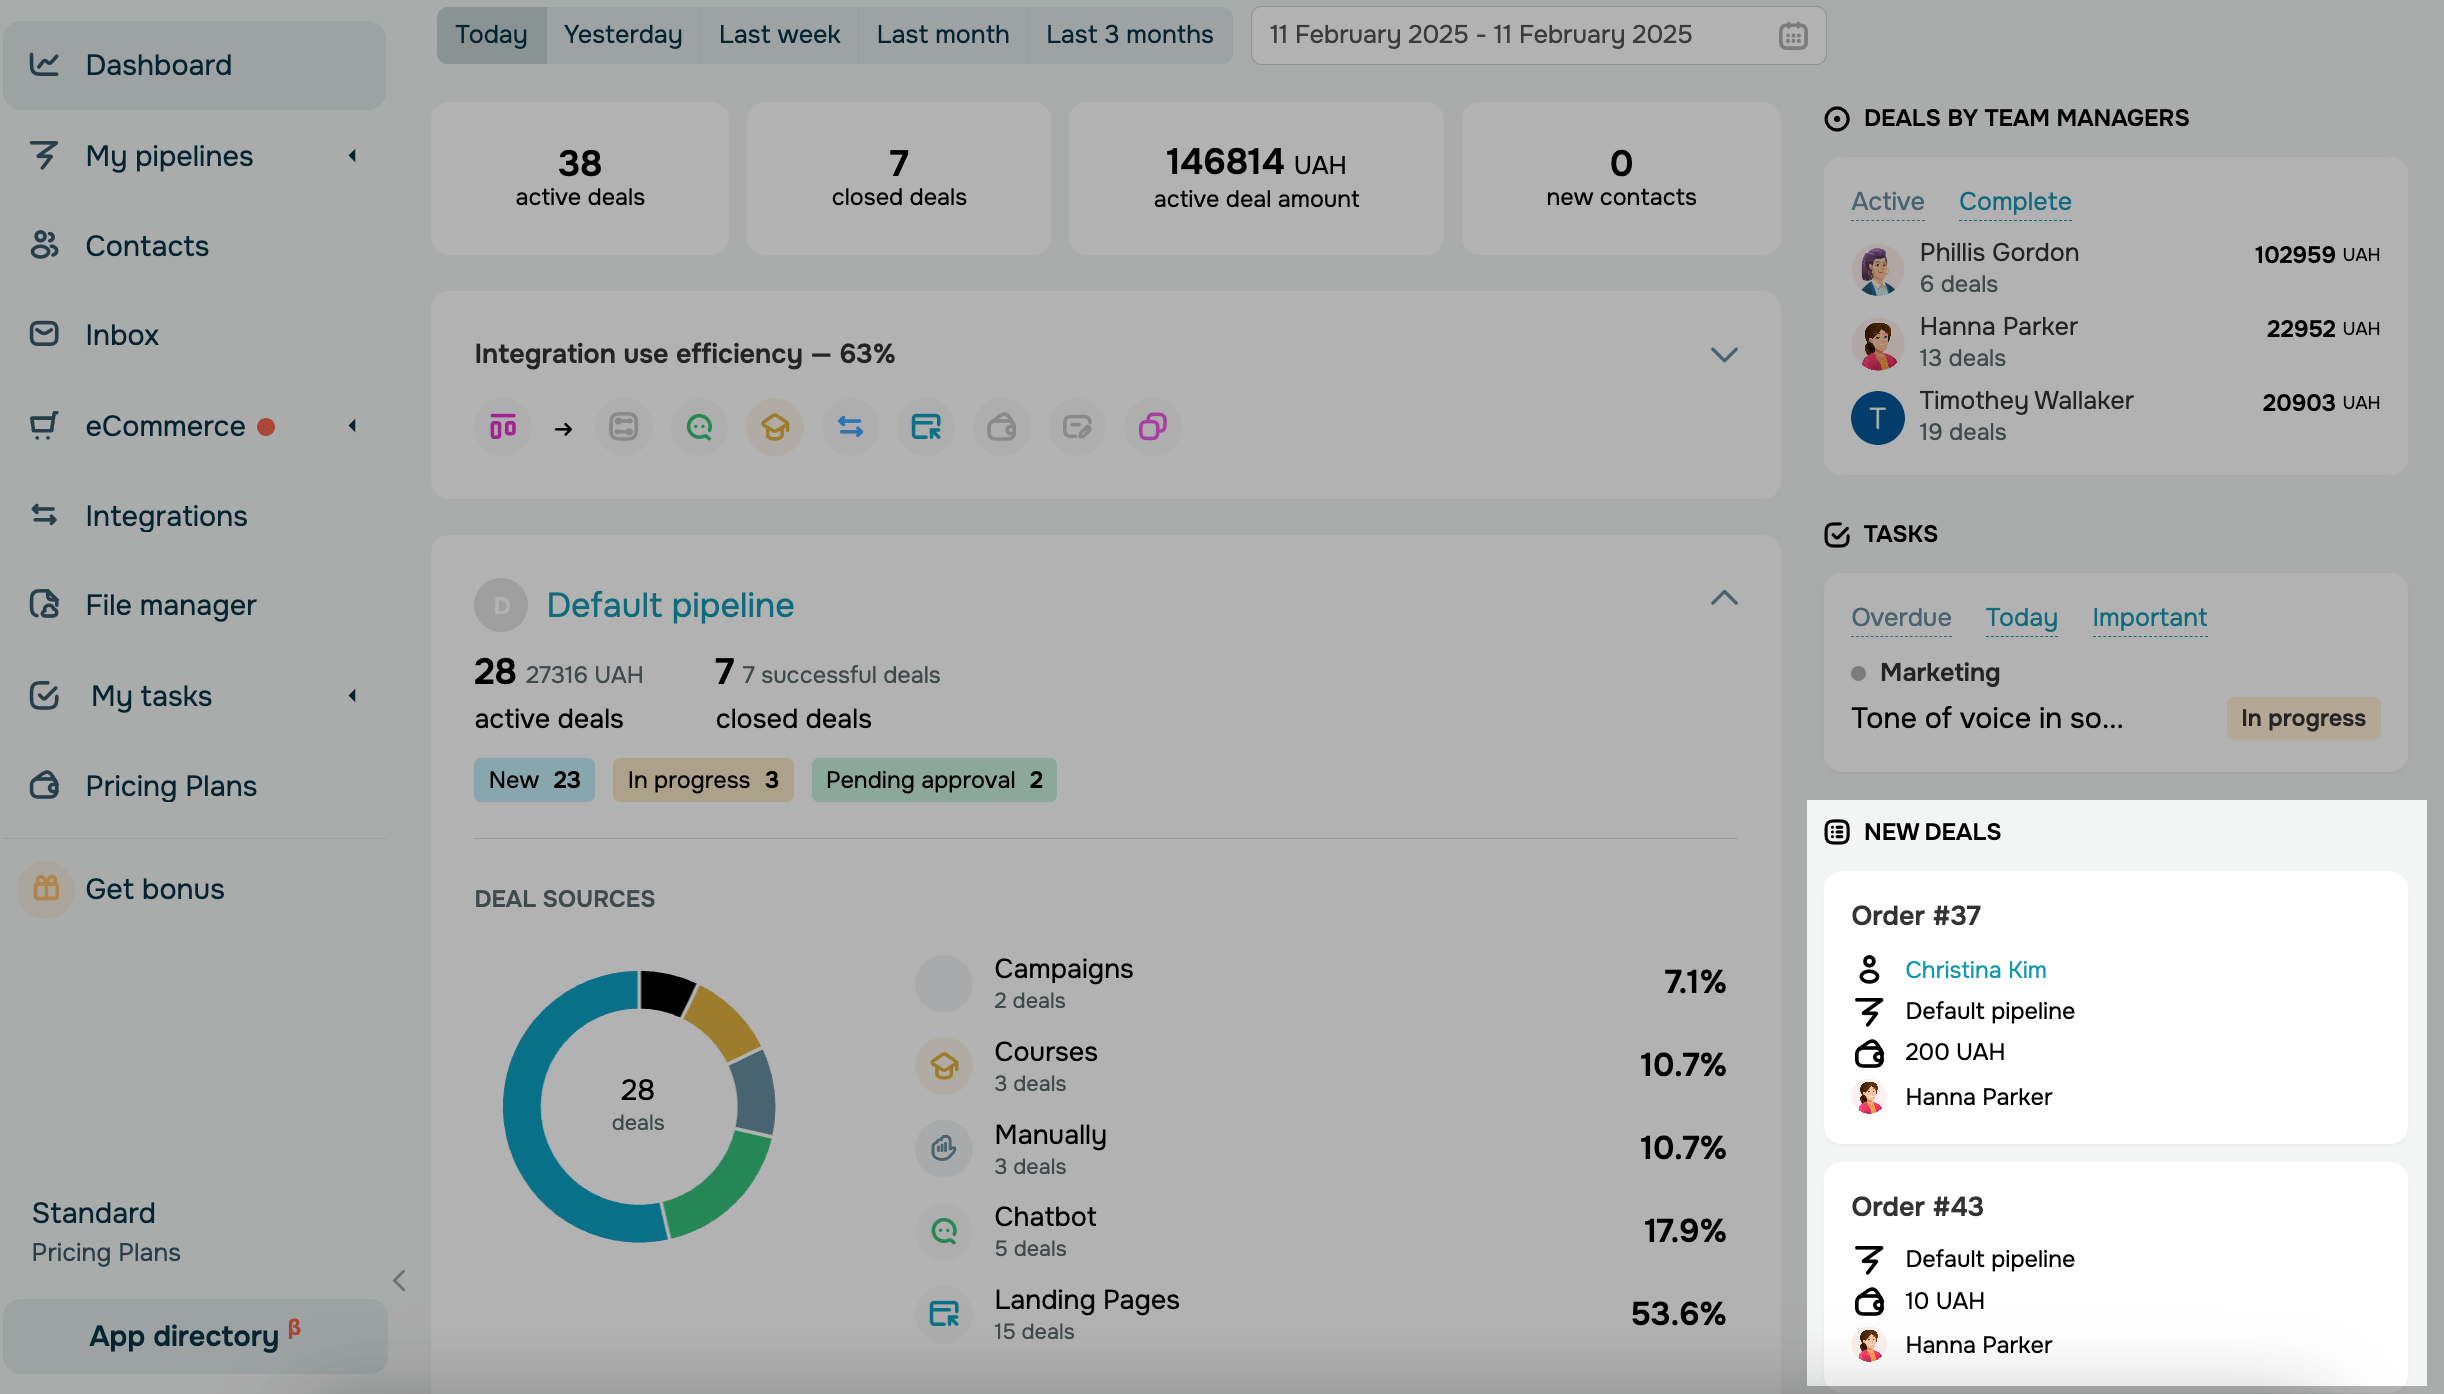
Task Statistics
In the "Tasks" section, you can view your task statistics in three tabs: "Overdue," "Today," "Important."
| Overdue | Tab includes tasks with expired due dates. |
| Today | Tab includes tasks that are due today. |
| Important | Tab includes tasks that are due today and are of high or medium priority. |
Tasks due in the future do not appear in this field.
Read more: How to Create a Task, How to Work with Tasks.
Click on a task name to go to its card.
New Deals Data
On the same page, you can view all of your recently created deals. The deal card displays the pipeline name, the number of the deal, and the team member responsible for the deal.
Last Updated: 21.09.2023
or