
Google Analytics is a service that allows you to gather information about your website or app and turn it into reports, enabling you to analyze and understand your company's performance. It helps you determine how effective your strategy and marketing efforts are, evaluate users’ data, and use this information to optimize specific areas of your business.
In this article, we’ll provide you with reasons to take advantage of Google Analytics, cover its key features and metrics, and share a step-by-step guide on how to set it up.
Why should marketers use Google Analytics?
As a platform for tracking website activity, Google Analytics enables you to collect and analyze vital data on user interactions with your content. Today, it is one of the most widely used tools for assessing a website's performance and monitoring various metrics. Here are additional reasons marketers can leverage Google Analytics for their business.
- Understanding your target audience. By gathering insights from your campaigns’ performance and the effectiveness of your marketing efforts, you can identify what your site visitors like the most. This analytics tool allows you to focus on creating more content users are interested in and optimizing your campaigns for better conversions, site visits, and engagement results.
- Evaluating the effectiveness of your marketing campaigns. By tracking the most crucial metrics after launching your campaigns, you can identify the level of engagement. Having all these indicators at hand enables you to instantly understand how successful your marketing efforts are and improve them when necessary.
- Keeping an eye on conversions. When you use Google Analytics, you can set it up to monitor specific goals, including downloads, form submissions, purchases, and other actions. Tracking your conversions allows you to enhance your marketing strategy and optimize it for better results.
- Optimizing your content strategy. Google Analytics enables you to have a clear understanding of your content performance. With its help, you can analyze top-performing content and web pages as well as have a closer look at those that have low levels of engagement. By doing so, you can figure out what keywords and content formats bring the most traffic to your website and adjust your strategy.
- Getting access to the real-time data. The tool provides access to real-time insights about your marketing campaigns, content updates, and website changes. It enables you to make informed decisions regarding optimization and future marketing steps
- Allocating your budget correctly. Once you have a clear understanding of each channel's and article's performance, you can focus on improving them. By allocating your budget to high-performing channels, pages, and platforms, you will maximize your revenue.
- Accessing customizable reports. Customizable dashboards and reports empower the platform to deliver information about the most crucial metrics. By emphasizing these insights, Google Analytics helps you concentrate on the right areas and respond swiftly to both positive and negative fluctuations in campaign and content performance.
Now that you have some reasons to take advantage of Google Analytics, it’s time to proceed to the next section to figure out how this tool works.
How does Google Analytics work?
Before using Google Analytics and reaping its benefits, you need to understand how it works. We’ll unveil this point in this section.
Everything begins when you create a Google Analytics account. After that, you need to add a small piece of JavaScript measurement code to each web page to start your site evaluation. This lets you collect information about interactions whenever a new visitor arrives on your site. You receive all the details about how an individual engages with specific web pages on your website. This code also gathers information about the language setting, browser type, device, and operating system. After collecting all the essential data, the code sends it to Google Analytics. The next step involves the platform processing this data and transforming it into reports.
When the tool processes the data and organizes it based on specific criteria crucial for your business. Since the platform is easily customizable, you can adjust how Google Analytics processes all the collected data. After applying filters and analyzing the data, the platform stores all the information in its database. Later, this information appears as reports that you can access anytime you want to explore the performance of your website, application, or content.
Now that you know the basics of Google Analytics operation, it’s time to proceed to the features you can use. Let’s dive in.
Key Features of Google Analytics
Google Analytics has many features that help marketers comprehensively understand user behavior, campaign performance, and marketing strategies. We’ll review the most essential ones to help you achieve your business goals faster.
- Behavior analytics. The tool can monitor various aspects of user behavior on your website or their interactions with your content and campaigns. It enables you to track page performance through metrics such as page views, bounce rate, and average time spent on the page. Since page load time means a lot for site visitors – especially when they use their smartphones –you can also evaluate your page speed and optimize it. Additionally, the platform allows you to keep an eye on interactions with users including button clicks, downloads, video views, and form submissions.
- Audience analysis. The next feature lets you gain insights into your users' age, gender, location, and interests. You can also analyze user journeys and identify patterns that will assist you with your future marketing strategies. Furthermore, Google Analytics enables you to group users based on similar characteristics, including location, behavior, and device.
- Traffic and acquisition. With the tool, you can identify traffic sources, analyze channels, and evaluate campaign performance. It enables you to understand whether users come from organic search, paid ads, social media, or referrals and focus on the most effective lead generation channels. Additionally, you can evaluate campaign performance with the help of custom URL parameters.
- Goal tracking. When using Google Analytics, you can easily monitor specific business goals, including form submissions, downloads, sign-ups, and others. If you are involved in eCommerce, it will help you keep an eye on your online store and transactions, revenue, and product performance related to it. The platform provides you with data on shopping behavior, abandoned carts, and the checkout process.
- Advanced segmentation. You can group users based on behavior, demographics, traffic sources, or goals. By segmenting site visitors, you can compare their performance for a better understanding of the factors that drive success.
- Data visualization. The platform allows you to visualize customer behavior and the journeys they take on your website. This helps you identify where and why users don’t convert. Google Analytics offers visual reports tailored to your needs and requirements.
Now that the features are clear, it’s time to move to the key metrics the platform helps you monitor. Let’s explore the most important ones.
Key Metrics
There are numerous crucial metrics you can track for your business using Google Analytics. We’ll uncover them in this section.
- Users. This metric indicates how many people visited your website during a specific period. It helps you determine the size of your audience and observe its growth over time. By checking the number of users across different timeframes, you can clearly see whether the number increases or decreases. This information helps you recognize when you need optimization.
- Sessions. It helps you determine the number of browsing sessions people have on your website during a specific timeframe. A session starts once users land on your website and ends when they leave it or demonstrate inactivity for 30 minutes. It can include various activities such as clicking the links, exploring content on several web pages, adding items to the shopping cart, or completing a purchase. This metric is essential for understanding interactions with your website, products, and content.
- New users. It shows the number of people who have interacted with your website for the first time during a specific timeframe. This helps you understand the effectiveness and relevance of your marketing efforts in attracting new potential customers to your site. You can track spikes in the number of new users after a successful social media ad, giveaway, or partnership with an influencer. A decrease might indicate a need to review your marketing strategy and make some adjustments.
- Average engagement time. This metric measures the time a specific user spends engaging with your content, products, company information, and more. It only applies to users who actively scroll through your web pages, not those who merely have your website open in the background. By tracking average engagement time, you can determine whether site visitors find your content engaging and your products worth considering.
- Bounce rate. It identifies the number of non-engaged sessions, which refer to instances where users leave your website after spending less than 10 seconds. During non-engaged sessions, users don’t complete any specific actions, such as providing their contact information or making a purchase. A high bounce rate indicates that your content fails to capture users’ attention. This serves as a prompt for you to investigate potential issues, including web design, loading time, navigation, content, and messaging. Problems in these areas may confuse site visitors and lead them to exit your site.
- Session conversion rate. This percentage represents the sessions that resulted in conversions. Conversion isn't solely about new purchases; it also includes new signups, downloads, completed contact forms, and so on. This metric helps you assess the effectiveness of your marketing campaigns and their ability to reach specific business objectives.
- Entrances. This metric refers to the number of sessions starting at a specific web page. It increases every time a new user begins a new session. This indicator helps you determine how users initiate interactions with your website.
- Exits. It shows you the pages where users usually stop interacting with your website. This metric enables you to find out the pages after which visitors leave your website. This is essential for identifying common patterns and understanding why these pages cause people to exit. Maybe they don’t provide all the necessary information, have confusing navigation, or have no mobile-friendly layout. These might serve as reasons for revising your website and content.
- Views per user. It refers to the number of pages a single user views during a session. High views per user indicate engaging content encouraging users to stay with your company.
Now that you know about the metrics Google Analytics helps you monitor, you might wonder how to set it up for your company. We’ll show you how to do it easily with our step-by-step guide.
How to set up Google Analytics?
To begin assessing your website's performance, you first need to set up Google Analytics. It only requires a few steps, which we’ll cover in this section.
1. Set up a new account
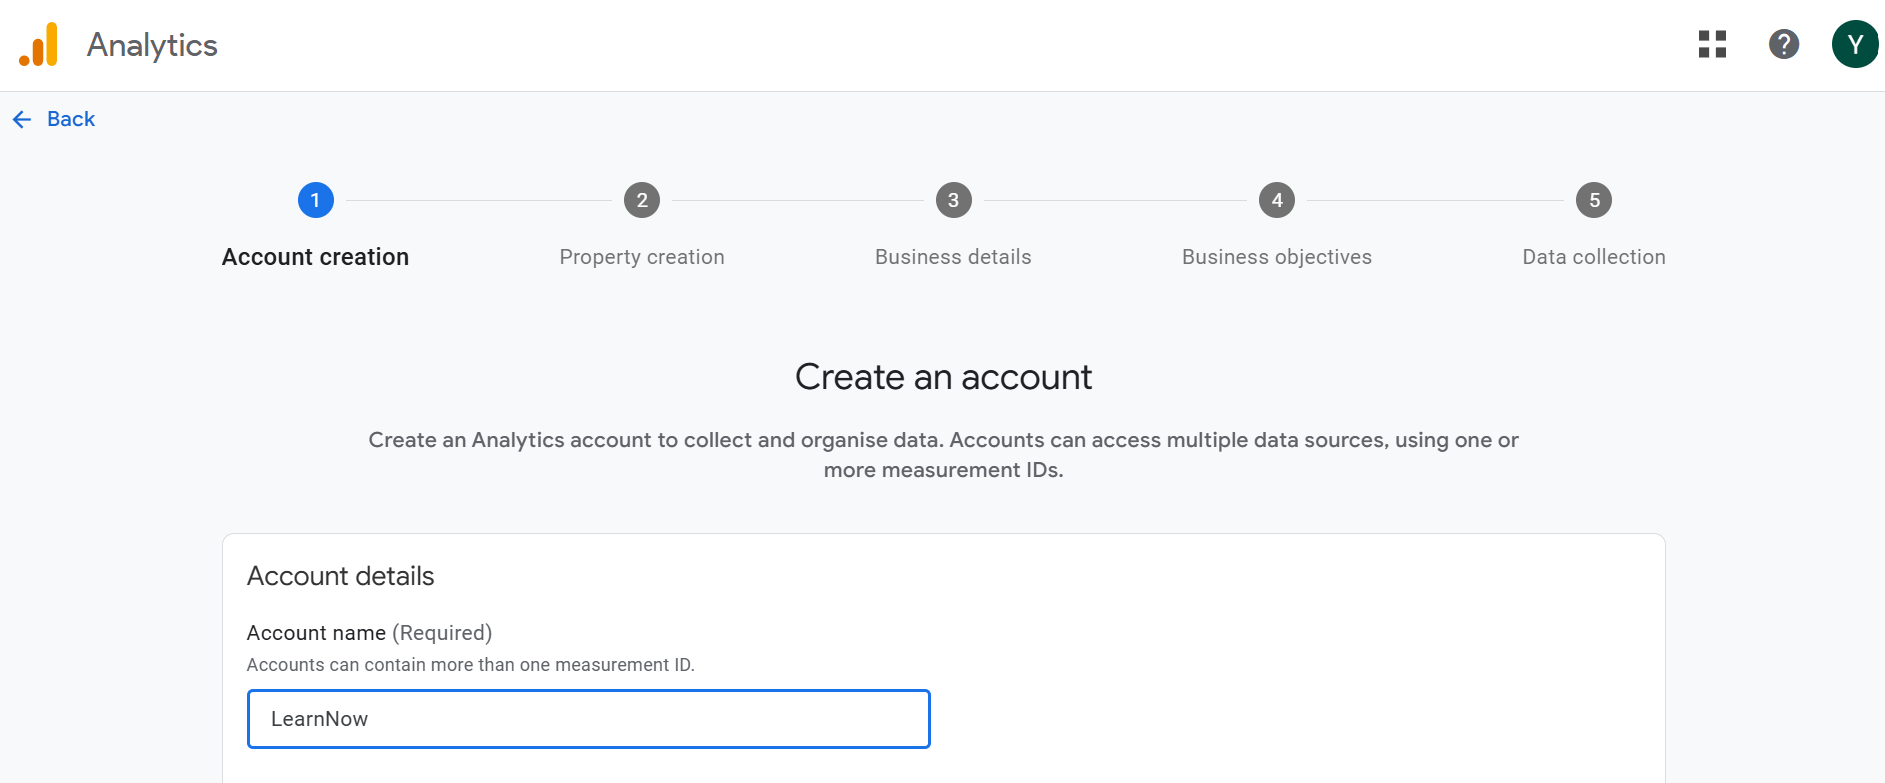
If you don’t have an account with Google Analytics, you should create one. The process is fast and simple because you only need to visit https://analytics.google.com, click “Start Measuring,” go to Admin, and click “Create” > “Account.” Then, insert your account name and configure the settings to determine which type of data you want to receive. Click “Next” to move on to the next step.
2. Create a property
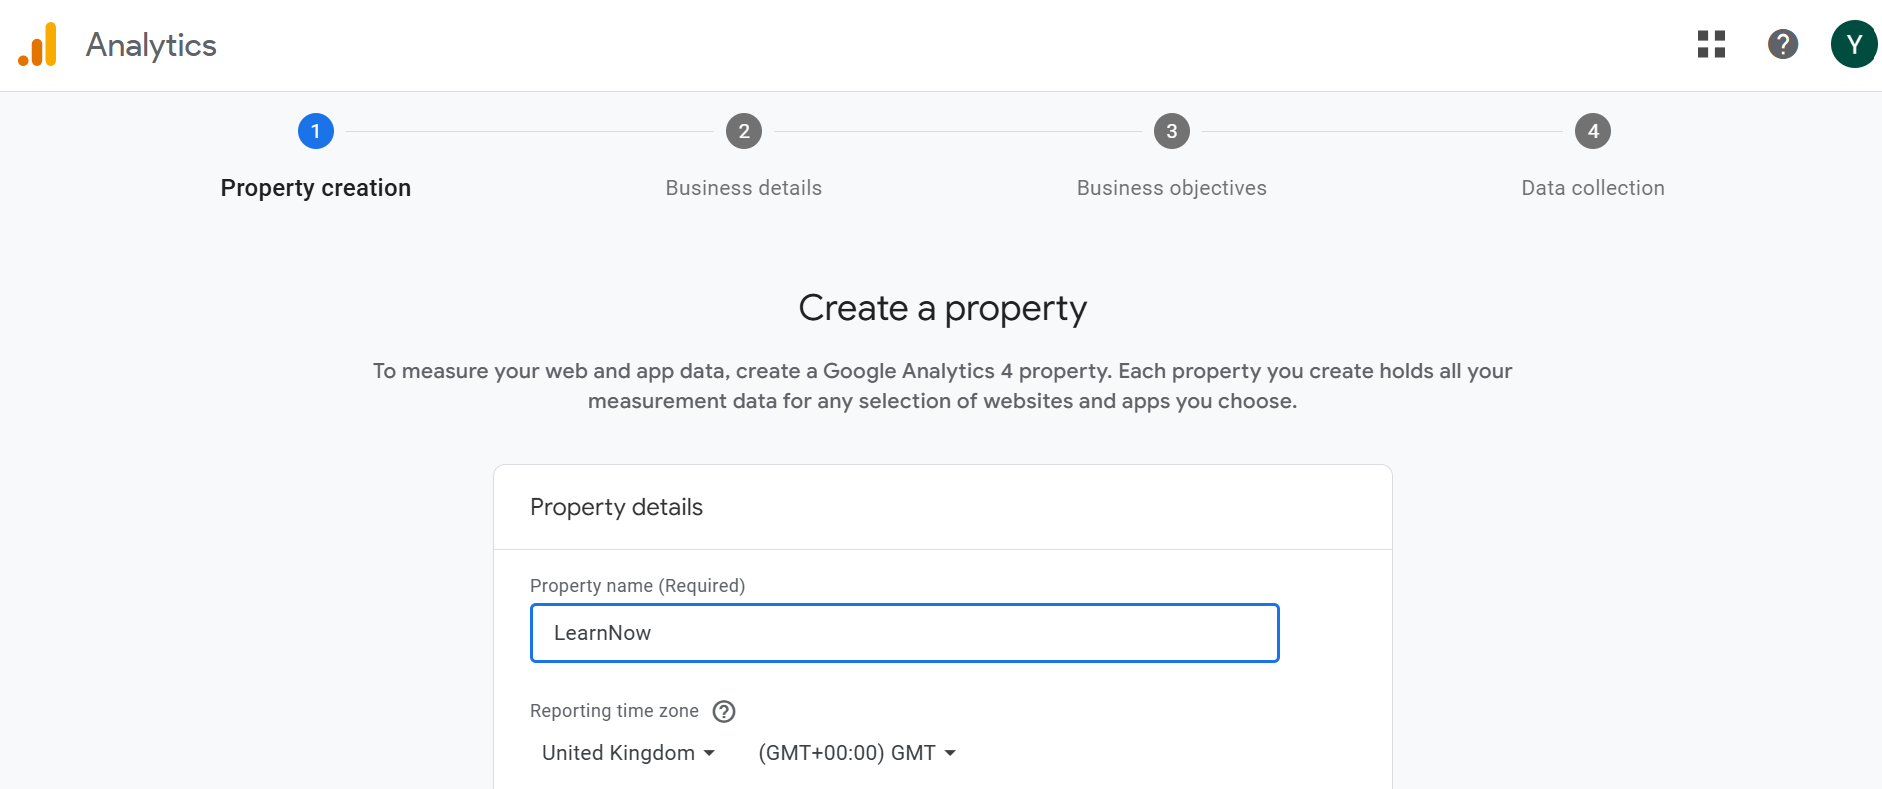
After setting up your account, you should add a new property. This refers to the process of grouping specific data from a website and making it one in Google Analytics. When you continue from creating a new Account, then insert all the necessary information about your property, including name, reporting time zone, and currency. After finishing, click “Next” to choose your industry category and company size. Click “Next” to identify reasons for using Google Analytics. Finally, click the “Create” button and accept the terms and conditions. To begin with data collection, you should add a data stream.
3. Add a data stream
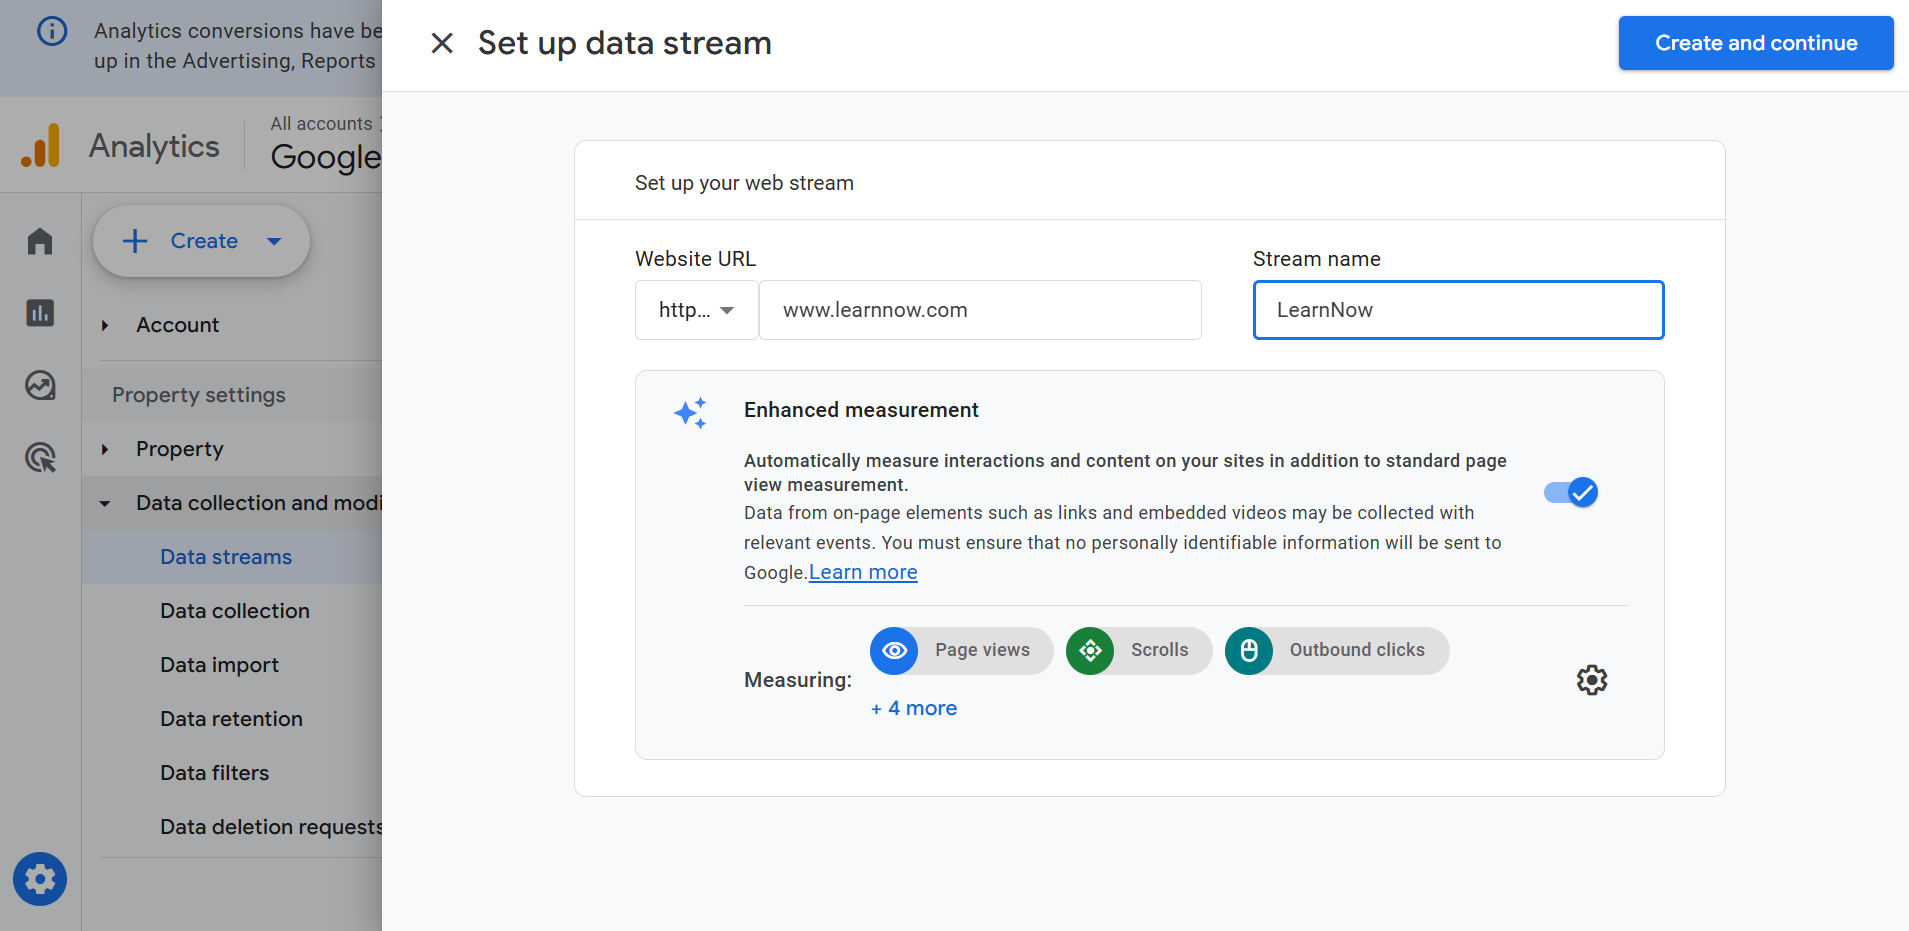
You can do it right after creating a new property, or you can go to “Admin” and, under “Data Collection and Modification,” proceed by clicking the “Data Streams” button. Then, click “Add stream” and select an iOS app, Android app, or Web, depending on your preferred operating system.
4. Start data collection
To start receiving all the necessary data to your Google Analytics account, you should add the tag to a website builder or CMS-hosted website, use Google Tag Manager, or add it directly to your web pages.
Now that you know how to set it up, it’s time to proceed to the strategies that will help you make the most out of your Google Analytics account.
7 Effective Ways to Use Google Analytics for Better Results
To successfully reach your business goals, you need to not only create a website but also understand how users interact with it. This means a lot for your potential customers, conversions, future growth, revenue, and other factors. That’s why we invite you to explore some working tips enabling you to benefit from Google Analytics at its most.
- Define clear goals. Having a clear understanding of how users interact with your website is important, but you also need to establish your objectives. This will help you concentrate on conversions in your Google Analytics account. In this context, goals should reflect the actions you want visitors to take on your site, such as downloading reports, submitting subscription forms, or making purchases. Once you have these clearly defined, you can assess the effectiveness of your marketing campaigns and content.
- Take advantage of filters. With the platform, you can apply filters to your views. They help you sort specific data. These filters can exclude unnecessary traffic from your website and monitor users who have visited your site.
- Group users into segments. Google Analytics allows you to collect different types of data about your site visitors. You can identify their age, location, gender, and even interests. By grouping users into segments based on similar characteristics, you can organize this information and take advantage of it. This can be done by optimizing your marketing campaigns and content, enabling it to resonate with different audience segments.
- Configure custom alerts. For better tracking, you can add custom alerts for specific events or metrics. After you set up these notifications based on certain conditions, you’ll be able to promptly react to any kind of changes in your traffic, conversions, new opportunities, etc. When you do this, you can proactively take action based on the conditions and prevent your business from bad scenarios.
- Create an event report. Configuring an event report enables you to evaluate users’ actions on your website, including clicking links, submitting subscription forms, downloading reports and other files, or buying your products. By covering these areas, you can effectively assess users’ behavior and understand what needs to be done to attain your primary goals. You’ll be able to share relevant content, present your products properly, and improve user experience.
- Pay attention to engagement metrics. When you are just starting with your website and Google Analytics, it’s crucial to understand how users interact with your website. You should consider metrics that show how long visitors stay on your website, how many web pages they visit, and what actions they take. These indicators can help you figure out a lot about your website quality, content relevance, and product in general. Consider looking through engaged sessions, average time spent, and engagement rate.
- Create custom reports. If you need to focus on specific processes and metrics, you can create custom reports. These reports will provide you with the information that matters to you right now. With the platform, you can analyze the interactions of specific segments with certain web pages of your website to ensure even more personalized experiences.
Overall, Google Analytics is a tool that provides a wealth of insights into your marketing strategy, campaign performance, engagement, and more. Understanding these factors is essential when you strategically plan each step toward building a loyal audience that engages with your content and prefers your products over those of competitors. Gaining a clear understanding of your current business situation enables you to contribute to its future growth and success.
or